Value Stream Mapping (VSM) is a key requirement in making organizations eliminate waste, maximize flow, and actually accomplish Lean process improvement in the current industrial environment where time is the major challenge. This is regardless of whether you are in manufacturing, healthcare, logistics, or any service related industry, practicing VSM enables you to view things anew and uncover the possibility of operational excellence.
This blog post guides you through the step by step process of carrying out a successful VSM analysis, scoping, bottleneck identification, and ultimately break through the bottlenecks in you.
What Is Value Stream Mapping (VSM)?
Value Stream Mapping is a graphical technique that is applied in Lean production and Lean Six Sigma approach to examining and planning the flow of products, data and information necessary in taking a product or service to a consumer. In contrast to the traditional process mapping, VSM pays attention to value added and non-value added activity, which gives the staff a chance to figure out the bottlenecks, inefficiencies, and delays that deteriorate performance. More knowledge of what is really happening to you now so you can be able to plan a more effective future position. So here are the requisite steps in Value Stream Mapping analysis.
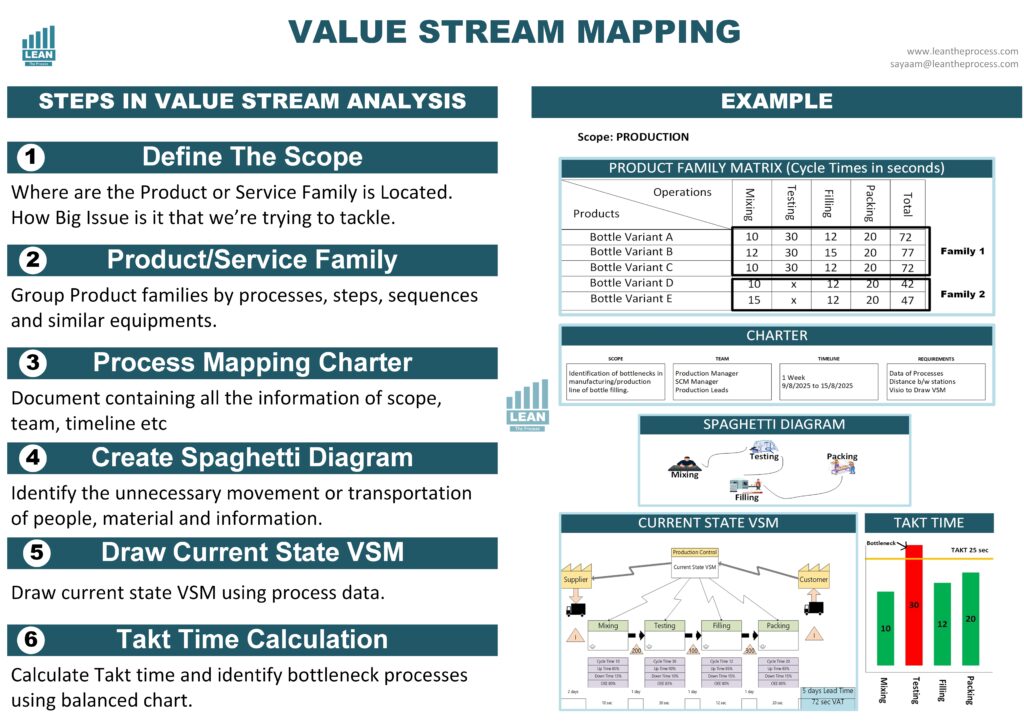
Step 1: Define the Scope of the Value Stream Mapping
Value stream mapping scope is not limited on just calculating lead time and value added time for manufacturing but also in services industry. One of the initial steps in VSM initiative should always be scope definition. Which is the process which you are mapping? What aspect of the operation should be taken care of? You will have to identify where the value stream you want to examine will begin and finish. Making it small would maintain the focus of the project manageable. Either when evaluating the whole production line, or a simple order to delivery, a clear boundary is a good step towards a good analysis.
Step 2: Identify the Product Family
A process does not treat every product in the same way. This is why it is important to determine the product family- which is a combination of products that pass through comparable steps and equipments. The identification of product family enables a product family not to be too complicated or a misleading value stream to be mapped. The one representative group will make your map be relevant and something that can be acted upon. This is normally conducted through a Product-Process Matrix where products with similar processes are shown.
Step 3: Develop a VSM Project Charter
As with any organised enhancement program, VSM analysis is enhanced by a project charter. The document includes the purpose of the project, its scope, team members, the project schedule and the anticipated results. The VSM charter averts any confusion by aligning all the stakeholders before the data collection process commences. It also sets duty and focus on your mapping team. Absent of the clear charter, the VSM activities get run in all directions without much emphasis.
Step 4: Create a Spaghetti Diagram
It is useful to evaluate physical transportation of material and individuals by Spaghetti Diagram as a warm-up to the existing state map. This diagram is a graphic representation of motion and in many cases shows chaotic and inefficient movements that introduce little more than motion waste. When you trace the actual flow of work you can find a place where layout redesign or reorganization of the process could improve the efficiency immensely. It is a great way to get in the mood prior to trying the detailed current state map.
Step 5: Draw the Current State Value Stream Map
This is the heart of your analysis. In this step, you visually document the actual flow of materials and information in the current process. The Current State VSM includes:
- Process steps
- Cycle times and lead times
- Inventory levels
- Information flow (signals, schedules, triggers)
- Waiting time and delays
Capturing accurate data is critical. The map provides a clear picture of where waste exists and where improvement opportunities lie. It bridges the gap between how people think the process works and how it actually works.
Step 6: Calculate Takt Time and Identify Bottlenecks
With your current state mapped, it’s time to apply some Lean math. Start by calculating Takt Time the rate at which a product must be produced to meet customer demand. The formula is:
Takt Time = Available Production Time / Customer Demand
Comparing Takt Time with the cycle time of each process step helps highlight bottlenecks the steps that cannot meet demand and therefore slow down the entire value stream.
Identifying bottlenecks is a critical step in VSM analysis. These constraints are often the main cause of delays, overproduction, and excess inventory. Once identified, these areas become top candidates for improvement in your future state design.