Description
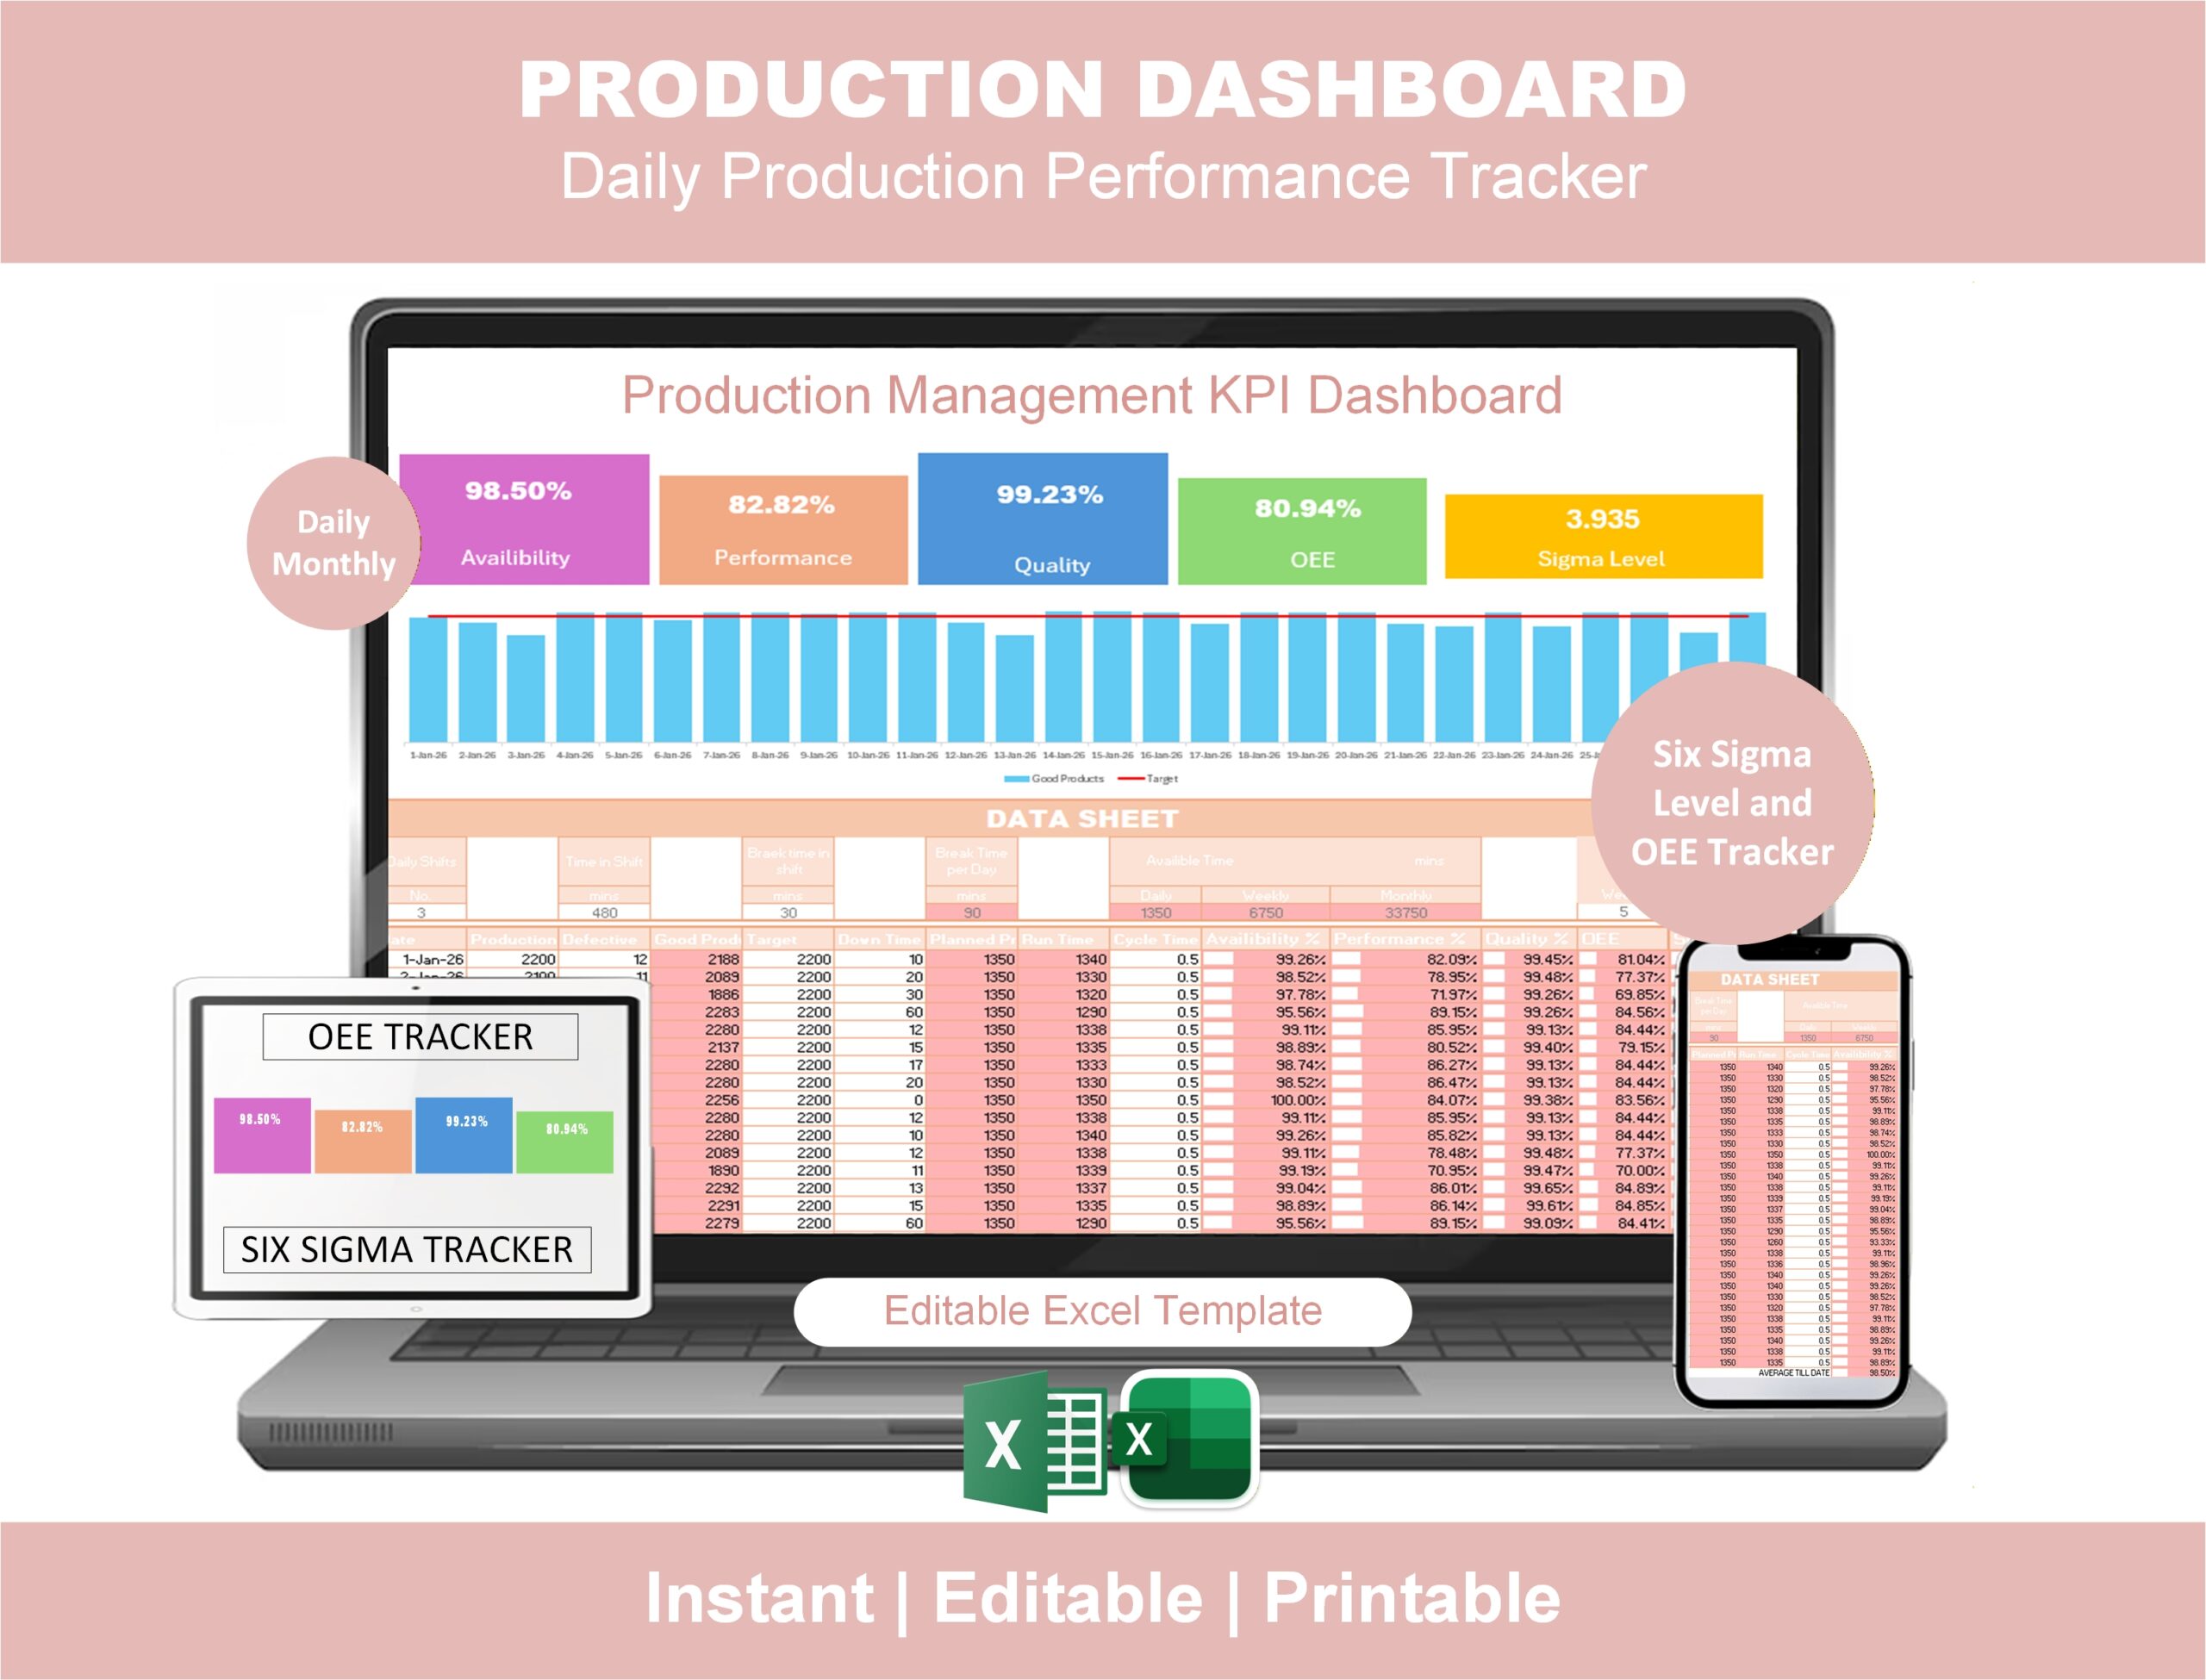
Track, analyze, and improve your manufacturing performance with this fully automated Production Management Dashboard Excel Template. Designed for production managers, Lean Six Sigma professionals, plant supervisors, and operations teams, this dashboard helps you monitor daily production metrics with clarity and accuracy.
This Production Management Dashboard calculates and visualizes:
✔ Availability
✔ Performance
✔ Quality
✔ OEE (Overall Equipment Effectiveness)
✔ Sigma Level
✔ Downtime
✔ Run Time
✔ Daily & Monthly Production Performance
With automated KPI calculations and dynamic charts, you can instantly identify inefficiencies, reduce waste, and improve process performance.
🔎 What’s Included:
-
📈 Production Management Dashboard
-
📊 OEE Tracker (Availability, Performance, Quality)
-
📉 Six Sigma Level Calculator
-
📅 Daily & Monthly Production Tracking
-
📋 Data Sheet with auto-calculations
-
🖥 Fully Editable Excel Template
-
🖨 Printable & professional layout
Perfect For:
-
Manufacturing Managers
-
Production Engineers
-
Lean Six Sigma Green/Black Belts
-
Factory Supervisors
-
Operations Teams
-
Industrial Engineers
-
Continuous Improvement Professionals
Why You’ll Love It:
This dashboard transforms raw production data into actionable insights. Instead of manually calculating OEE and Sigma Level, simply input your production numbers and let the automated formulas handle the rest.
It saves time, improves decision-making, and helps you track shop floor performance in a structured, professional way.
File Format:
-
Microsoft Excel (.xlsx)
-
Instant Download
-
Fully Editable
-
No Macros Required
Reviews
There are no reviews yet.