Understanding and improving business processes is essential for achieving operational excellence. One powerful tool that organizations use to visualize and streamline processes is the SIPOC diagram. In this blog post, we will explore what a SIPOC diagram is, its components, benefits, and how to create one effectively. Whether you are involved in Lean Six Sigma, process improvement, or quality management, mastering the SIPOC diagram can help you enhance efficiency and deliver better results.
What is a SIPOC Diagram?
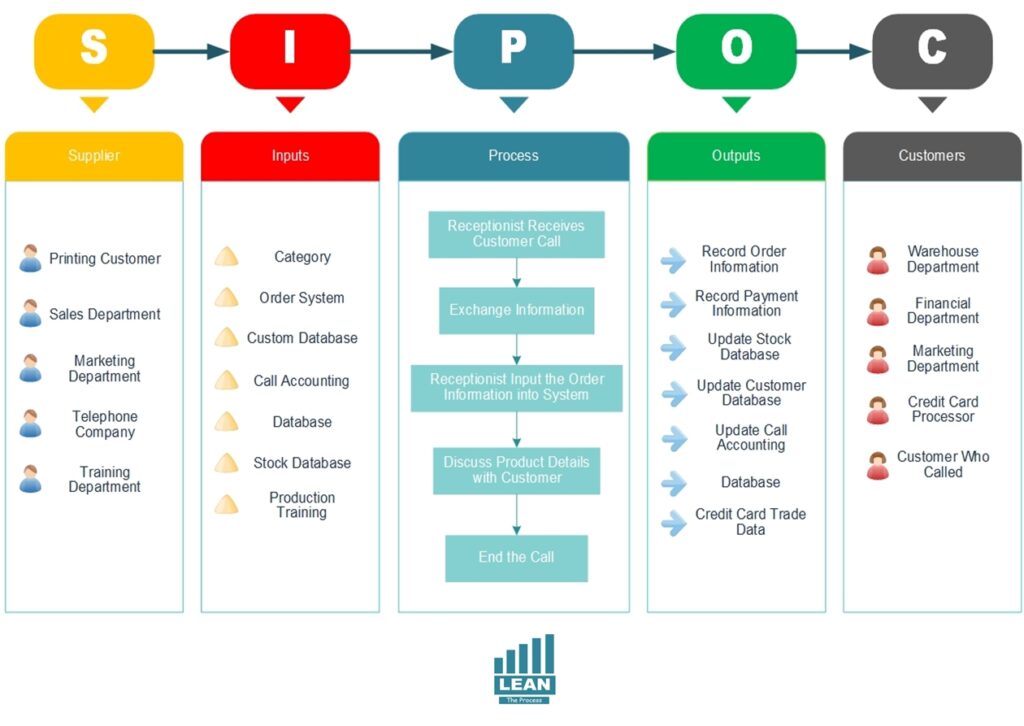
A SIPOC diagram is a visual tool that stands for Suppliers, Inputs, Process, Outputs, and Customers. It provides a high-level overview of a process, helping teams understand the key elements that influence process performance. The diagram is typically used in the Define phase of the DMAIC methodology in Lean Six Sigma, but it is also valuable in various process improvement initiatives. By mapping these elements, organizations can identify areas for optimization and ensure that processes align with customer requirements.
Become certified Process Mapping Expert !!
Components of a SIPOC Diagram
- Suppliers: Entities that provide the necessary inputs for the process. Suppliers can be internal departments, external vendors, or individuals.
- Inputs: Resources, materials, information, or equipment required to execute the process. Identifying inputs is crucial for understanding process dependencies.
- Process: The series of steps or activities performed to transform inputs into outputs. This section provides a simplified overview of the workflow.
- Outputs: The results or products generated by the process. Outputs must meet predefined quality and performance standards.
- Customers: Individuals or organizations that receive the outputs. Understanding customer needs is essential for delivering value.
Benefits of Using a SIPOC Diagram
Using a SIPOC diagram offers several benefits, including:
- Clear Process Visualization: Provides a clear and concise overview of the process, making it easier for teams to understand and analyze workflows.
- Improved Communication: Facilitates better communication among stakeholders by establishing a common understanding of the process components.
- Identifying Process Boundaries: Defines the start and end points of a process, ensuring that improvement efforts focus on the relevant areas.
- Enhanced Problem-Solving: Helps teams identify root causes of process issues and develop effective solutions.
- Alignment with Customer Needs: Ensures that processes are designed to meet customer expectations, improving satisfaction and loyalty.
How to Create a SIPOC Diagram
Creating a SIPOC diagram is a straightforward process that involves the following steps:
- Define the Process: Start by identifying the process you want to map. Clearly define the process scope, including its start and end points.
- Identify the Process Steps: Outline the main steps involved in the process. Focus on high-level activities rather than detailed tasks.
- List the Outputs: Determine the key outputs produced by the process. Ensure that outputs align with customer requirements.
- Identify the Customers: Specify the individuals or organizations that receive the outputs. Understanding customer needs is crucial for process improvement.
- List the Inputs: Identify the essential inputs required to perform each process step. Inputs can include materials, information, and equipment.
- Identify the Suppliers: Determine the entities that provide the inputs. Suppliers can be internal or external to the organization.
- Organize the Information: Arrange the information in a tabular format, with columns labeled Suppliers, Inputs, Process, Outputs, and Customers.
Example of a SIPOC Diagram
To illustrate, let’s consider a simple example of an order fulfillment process:
- Suppliers: Inventory department, shipping company
- Inputs: Order details, packaging materials, shipping labels
- Process: Receive order, pick items, pack items, ship order
- Outputs: Shipped order, tracking number
- Customers: Retail customers, business clients
Best Practices for Using a SIPOC Diagram
- Collaborate with Stakeholders: Involve key stakeholders from different departments to ensure a comprehensive understanding of the process.
- Keep it Simple: Focus on high-level elements and avoid unnecessary details. The goal is to provide a clear overview.
- Align with Business Goals: Ensure that the process aligns with organizational objectives and customer expectations.
- Review and Update Regularly: Continuously review and update the SIPOC diagram as processes evolve to maintain accuracy.
- Use Visual Tools: Leverage software tools like Minitab, Lucidchart, or Microsoft Visio to create visually appealing and professional diagrams.
Conclusion
A SIPOC diagram is a valuable tool for visualizing and improving business processes. By mapping suppliers, inputs, processes, outputs, and customers, organizations can gain a deeper understanding of their workflows and identify opportunities for optimization. Whether you are implementing Lean Six Sigma or pursuing general process improvements, incorporating SIPOC diagrams into your toolkit can help you achieve greater efficiency, better quality, and enhanced customer satisfaction.
I have bookmarked your blog and refer back to it whenever I need a dose of positivity and inspiration Your words have a way of brightening up my day
Thank you for always being open and honest with your readers It’s refreshing to see a blogger who is unafraid to be vulnerable and real
Your words have resonated with us and we can’t wait to read more of your amazing content. Thank you for sharing your expertise and passion with the world.
Your knowledge and expertise on various topics never ceases to amaze me I always learn something new with each post
I have been struggling with this issue for a while and your post has provided me with much-needed guidance and clarity Thank you so much