Description
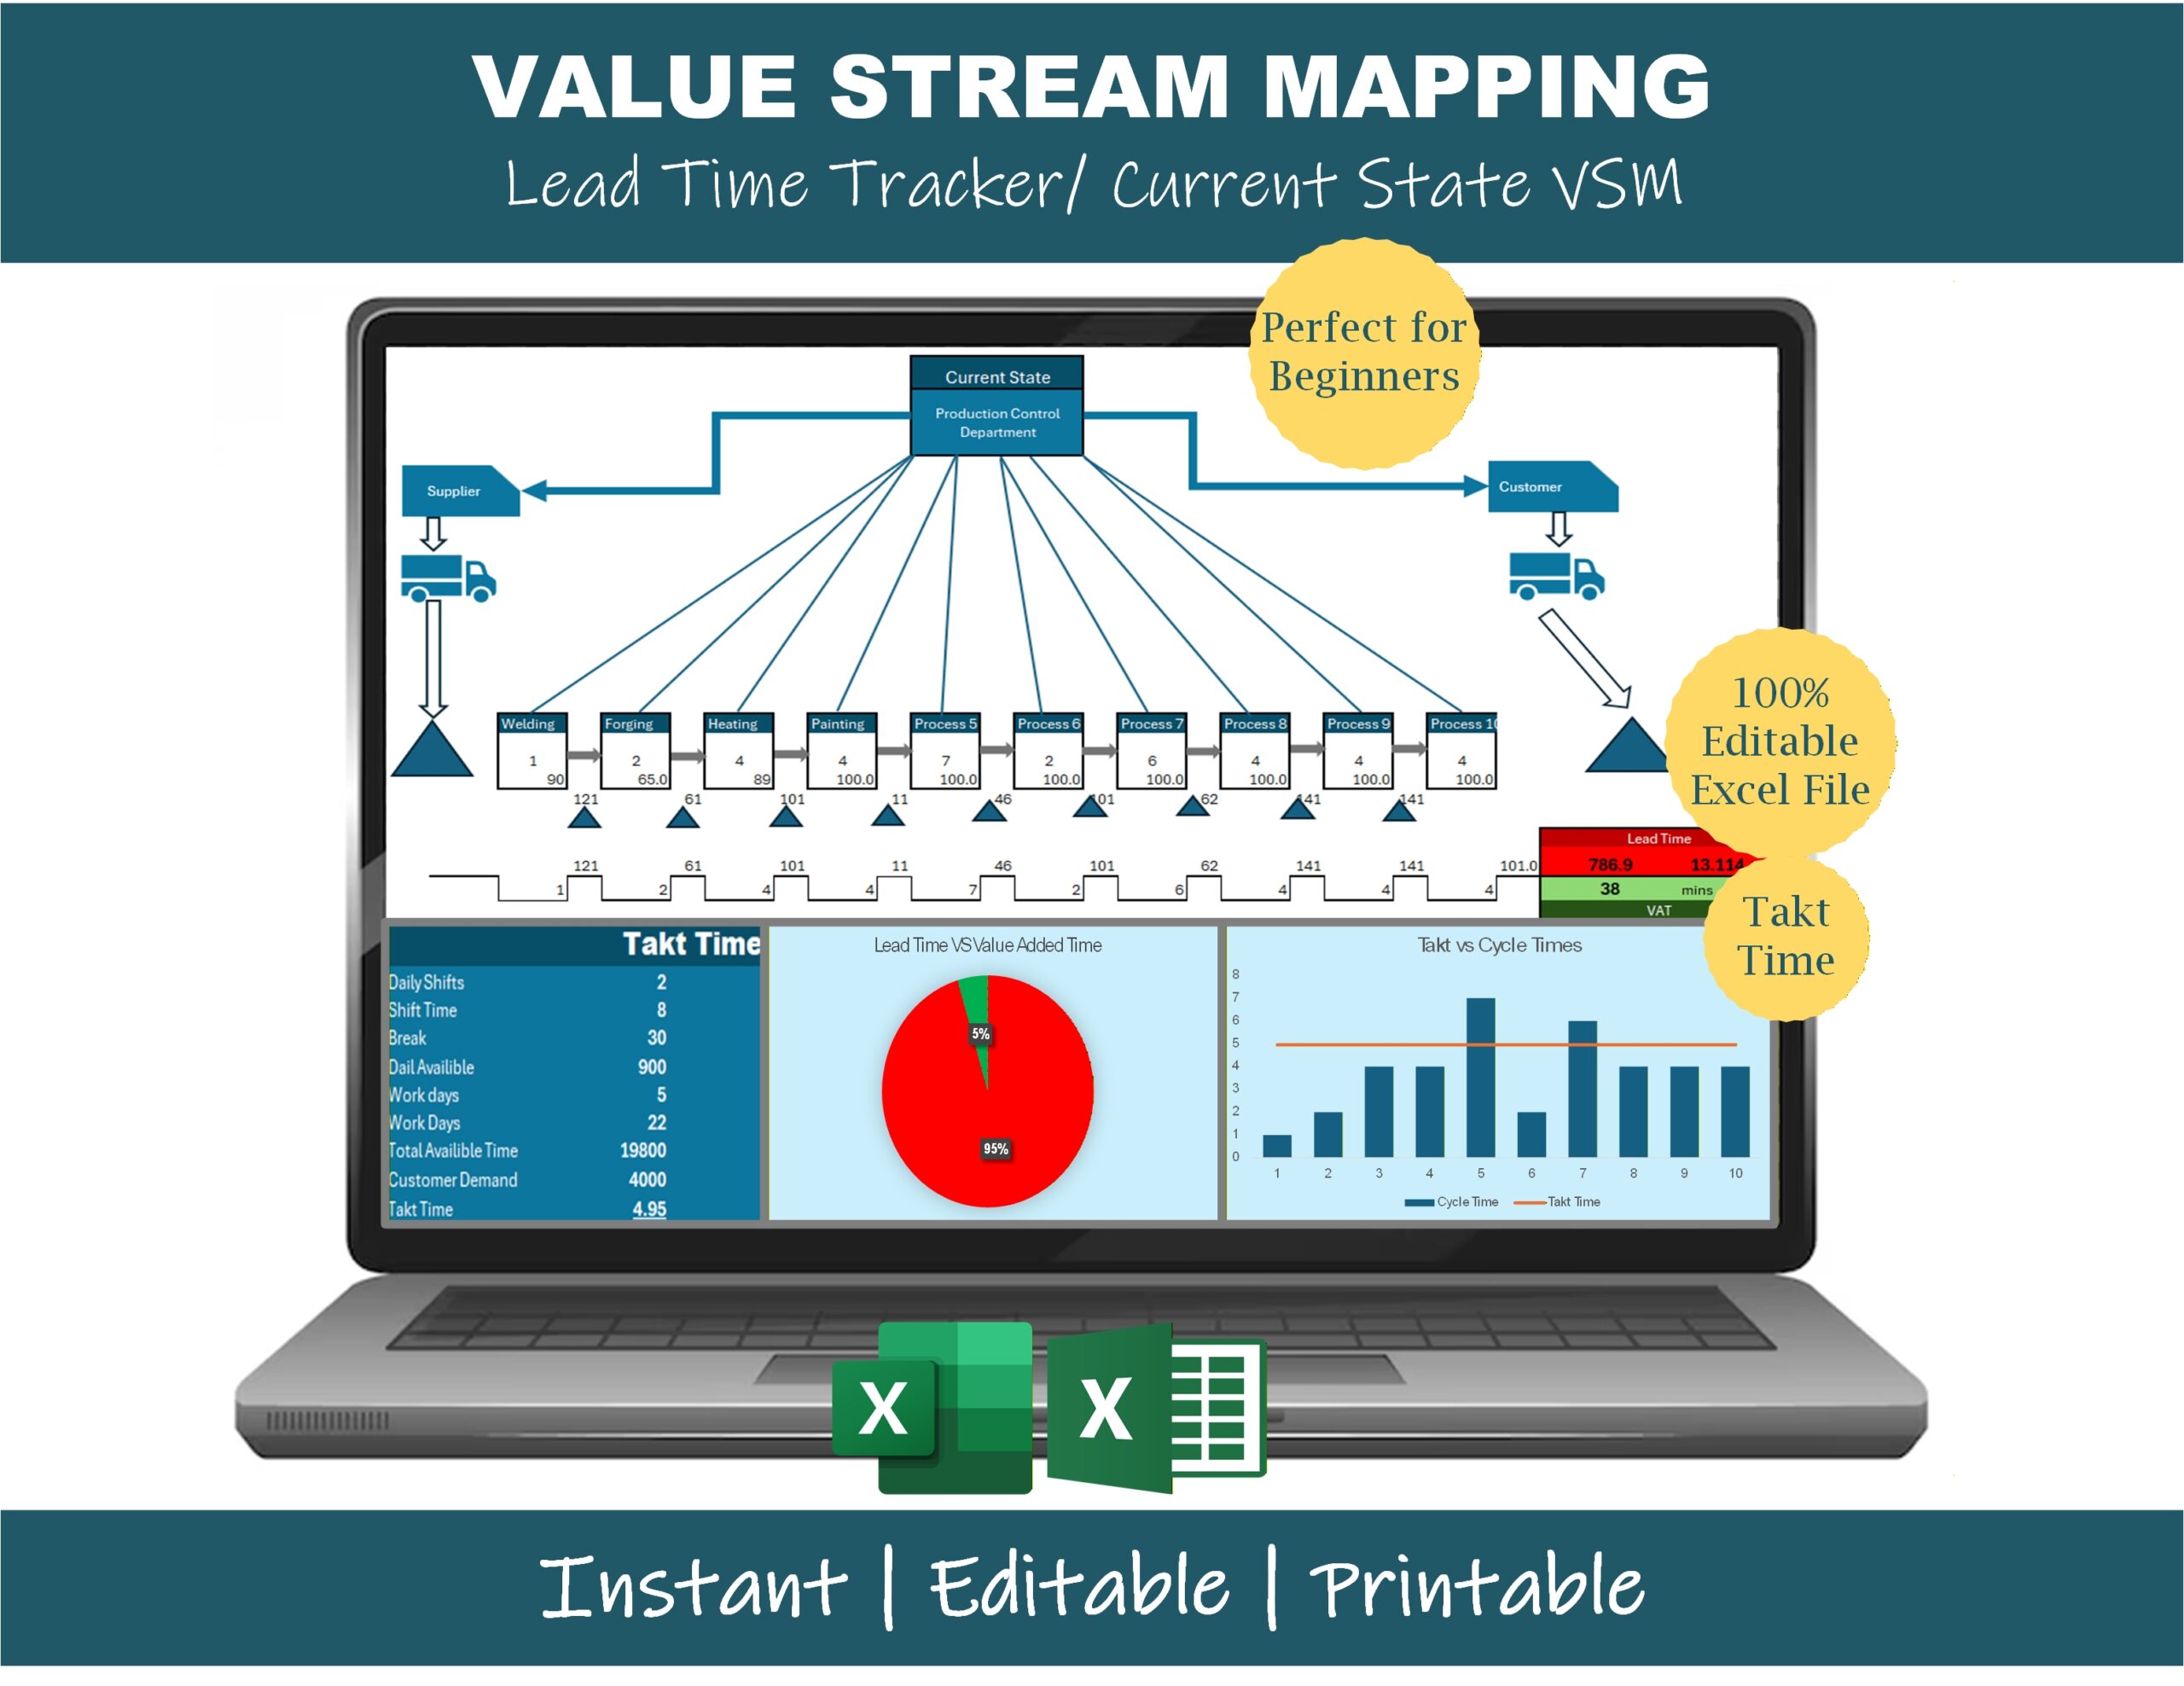
Map your current state in Excel — no Visio, no Lucidchart, no learning curve.
Value Stream Mapping is one of the most powerful Lean tools, but most VSM software is either expensive, locked behind a subscription, or so complex that you spend more time learning the tool than mapping the process. This Value Stream Mapping Excel template solves that — you get a clean, editable, Lean-standard VSM layout that runs in plain Microsoft Excel, with built-in calculators that do the math for you.
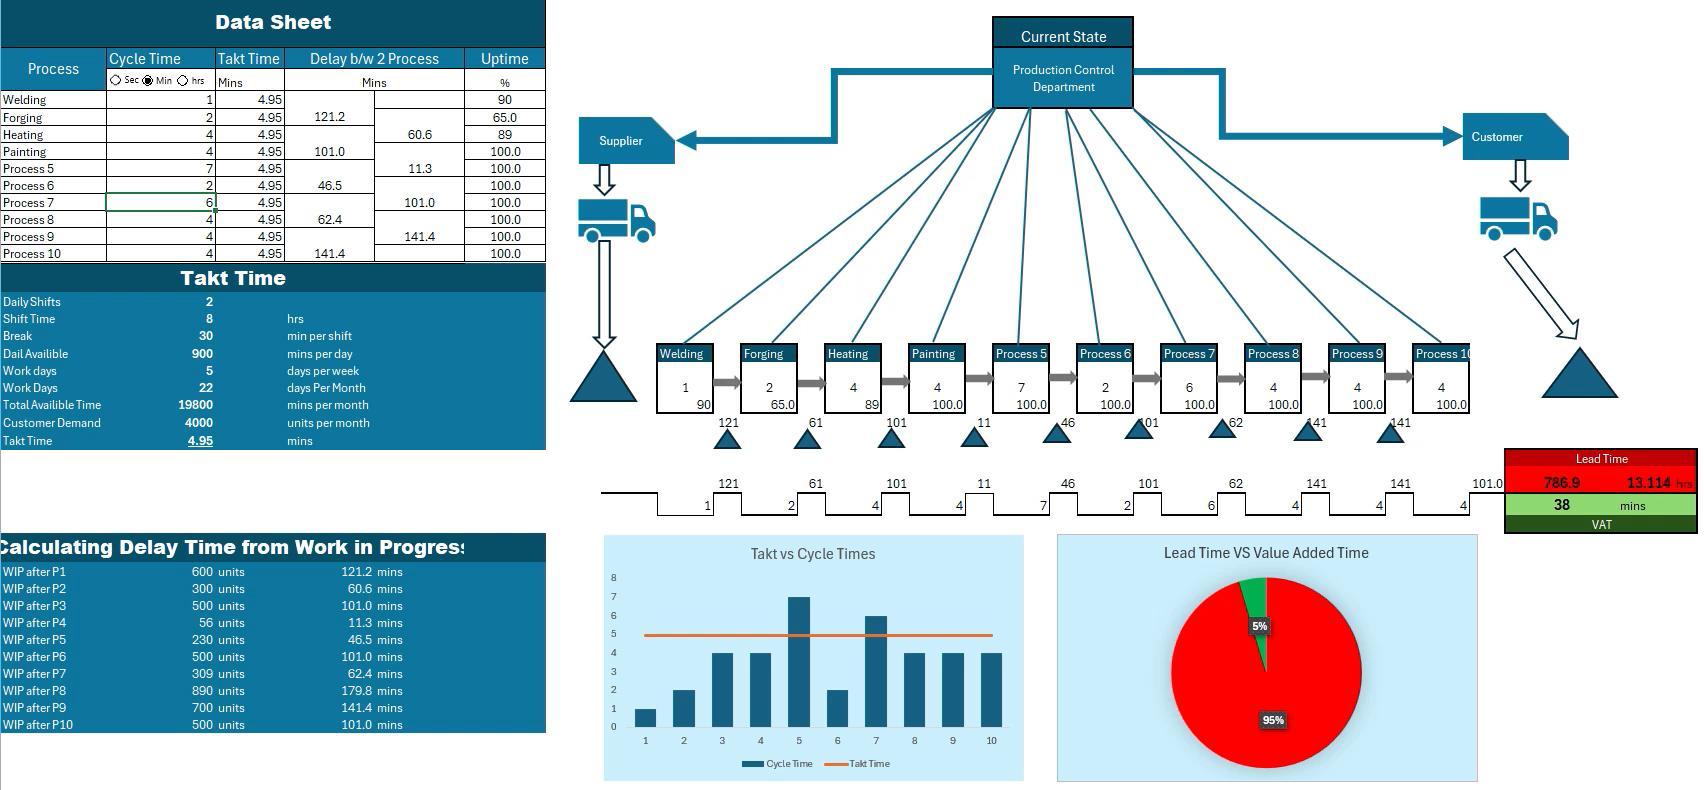
Drop in your process steps, cycle times, changeovers, uptime, and inventory — and the template automatically builds your lead time ladder, calculates takt time, and shows your value-added vs non-value-added ratio. Whether you’re a Lean Six Sigma student mapping your first process or an industrial engineer doing a real shop-floor VSM, this template gets you to insights faster.
What’s included in the VSM Excel template
🗺️ Current State VSM layout (editable)
- Supplier → Process → Customer flow
- Process boxes with cycle time, changeover, uptime, operators, and shifts
- Information flow arrows (electronic and manual)
- Push, pull, and FIFO arrows
- Inventory triangles with WIP quantity
- Truck shipping icons with frequency
⏱️ Built-in Lean calculators
- Takt Time Calculator (available time ÷ customer demand)
- Lead Time Ladder (manual and automatic tracking)
- Cycle Time vs Takt Time comparison chart
- Value-Added vs Non-Value-Added Time dashboard
- Process Cycle Efficiency (PCE = VA time ÷ total lead time)
- Little’s Law quick calculator
📊 Visual outputs
- Lead Time Ladder showing process time and inventory wait
- Bottleneck identification (cycle time > takt time flagged automatically)
- WIP-by-process bar chart
- Lead time vs value-added time comparison
📋 Supporting sheets
- Data collection template (cycle time, changeover, uptime per process)
- Customer demand input
- Available work time calculator (shifts, breaks, planned downtime)
- Notes and assumptions log
Who this VSM Excel template is for
- Lean manufacturing professionals mapping production lines
- Six Sigma Green Belts and Black Belts building current-state VSMs for projects
- Manufacturing and industrial engineers identifying bottlenecks
- Operations and production managers visualizing flow
- Continuous improvement consultants delivering Lean engagements
- Engineering and operations students learning VSM as part of Lean coursework
- Anyone moving from manual whiteboard VSM to a digital, editable format
No advanced Excel skills required — this template is designed to be beginner-friendly.
Why use this Value Stream Mapping Excel template
- Lean-standard symbols — process boxes, information flow, push/pull arrows match the original Toyota / Rother & Shook conventions
- Auto-calculated metrics — lead time, takt time, cycle time, and PCE all calculated from your inputs
- Editable everything — colors, layout, formulas, symbols can all be adjusted
- Printable — designed to print cleanly on A3 / 11×17 for posting on the shop floor
- No software required — works in any modern Excel (Windows, Mac, Excel for Web)
- Instant download — you get the file immediately after purchase
Frequently asked questions
Q: Does this Value Stream Mapping template work in Excel for Mac? A: Yes. The template uses standard Excel formulas and shapes that work in Excel for Windows, Mac, and Excel for Web. No macros are required.
Q: Is this a current-state or future-state VSM template? A: This template is built for current-state mapping — the first step of any VSM exercise. Once you’ve mapped your current state, you can save a copy and use it as the basis for your future-state map.
Q: Can I add or remove process steps? A: Yes — process boxes can be copied, deleted, or moved. The lead time ladder updates automatically when you add or remove steps.
Q: Will the template show me where my bottleneck is? A: Yes — any process step where cycle time exceeds takt time is automatically flagged. The Cycle Time vs Takt Time chart makes the bottleneck visible at a glance.
Q: Do I need to know advanced Excel? A: No. If you can enter numbers in cells, you can use this template. All formulas are pre-built — you just enter your process data.
Q: Can I use this template for non-manufacturing processes (services, healthcare, office)? A: Yes — many users adapt it for service VSMs (insurance claims processing, hospital patient flow, software development, order-to-cash). The structure works for any process where you have steps, cycle times, and inventory/WIP between them.
Q: How do I receive the file after purchase? A: Instant email download link, plus access from your account area on the site.
Q: Refund policy? A: 7-day money-back guarantee — if it’s not the right fit, contact us for a full refund.
Related Lean tools
If you’re doing VSM, you’ll probably also want:
- VSM Generator & Process Analysis Tool — auto-generates the VSM diagram from your data
- VSM Analysis Tool — Automated Bottleneck Detection — deeper bottleneck analysis on existing VSMs
- DMAIC Toolkit — full Lean Six Sigma project toolkit (includes VSM)
- A3 Problem Solving Template — for documenting findings from your VSM
Click “Add to cart” above to download the Value Stream Mapping Excel template instantly.
Reviews
There are no reviews yet.