Description
Turn Your Daily Production Data Into an Automatic Cost of Poor Quality (COPQ) Report
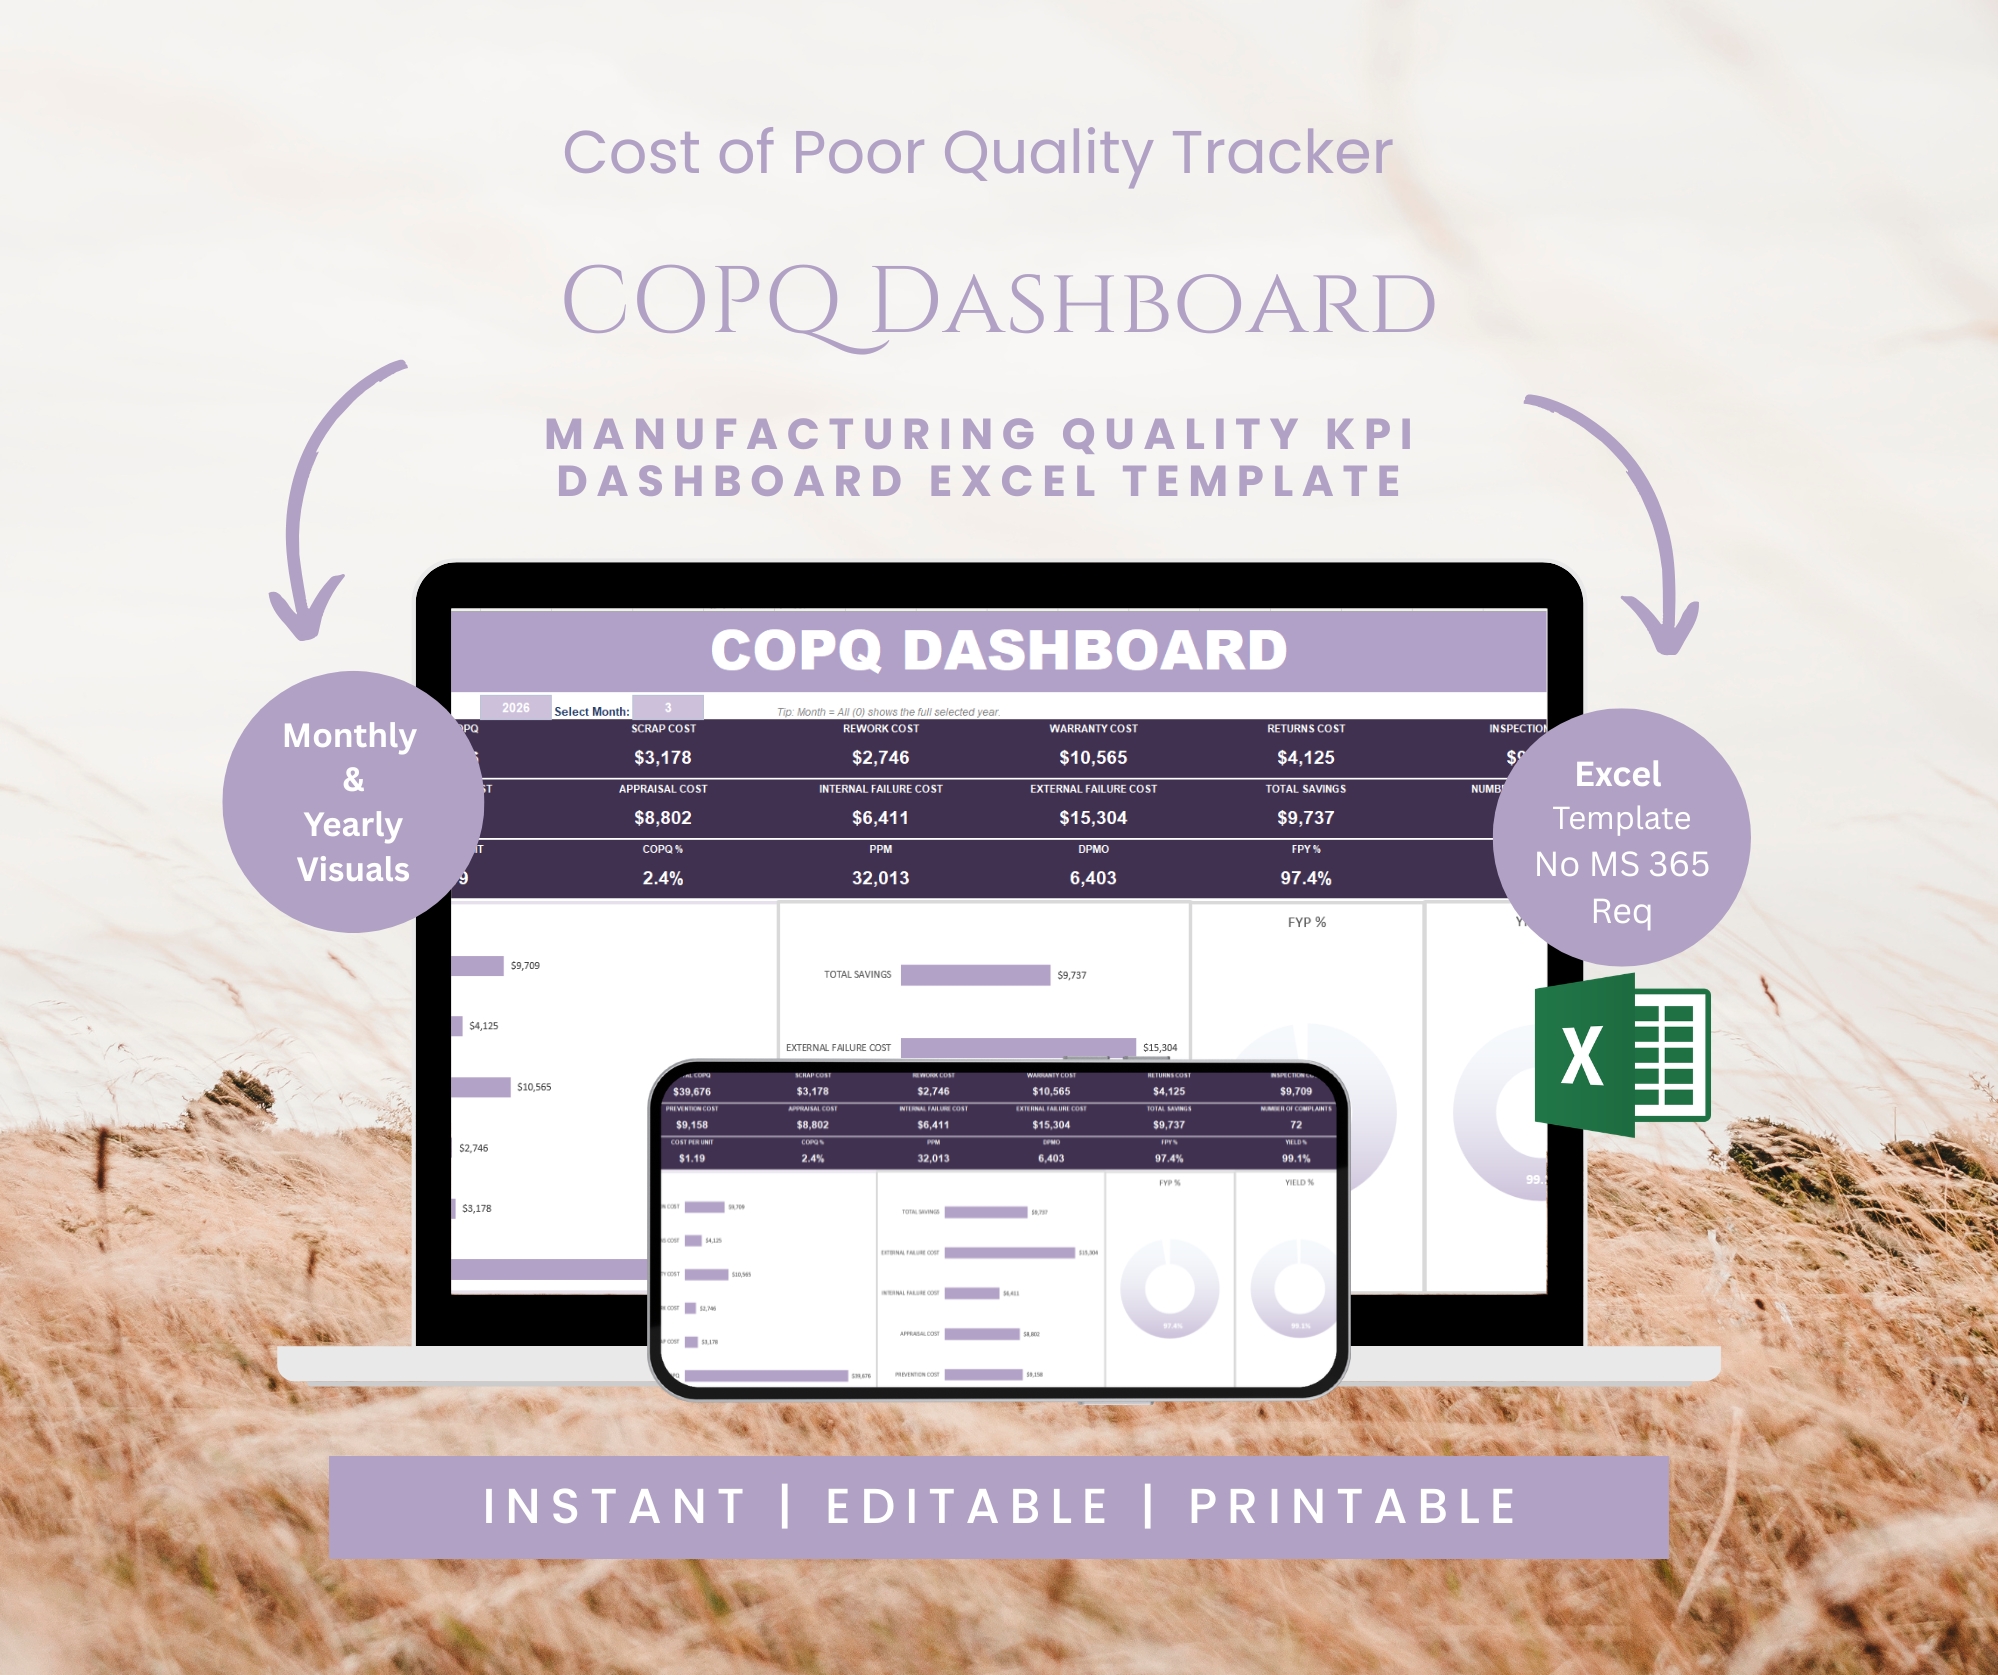
Stop rebuilding quality-cost spreadsheets every month. The COPQ Dashboard Excel Template is a fully automated Cost of Poor Quality tracker built for manufacturing, production, and quality management teams. Log your daily scrap, rework, warranty, and inspection numbers, and every KPI, chart, and trend line updates itself — instantly, with zero manual formulas.
This is the same Cost of Quality framework used in Six Sigma, Lean Manufacturing, and ISO 9001 quality systems — pre-built into a clean, professional Excel dashboard you can start using today.
Why Track Cost of Poor Quality (COPQ)?
Every defect, scrap unit, rework hour, and warranty claim has a hidden dollar cost. Most manufacturers feel quality problems are expensive but can’t put a number on it — which makes it nearly impossible to justify a quality improvement project, a new inspection process, or a Six Sigma initiative to leadership. This template solves that by turning your daily shop-floor numbers into one clear, defensible cost figure your management team can act on.
What’s Included
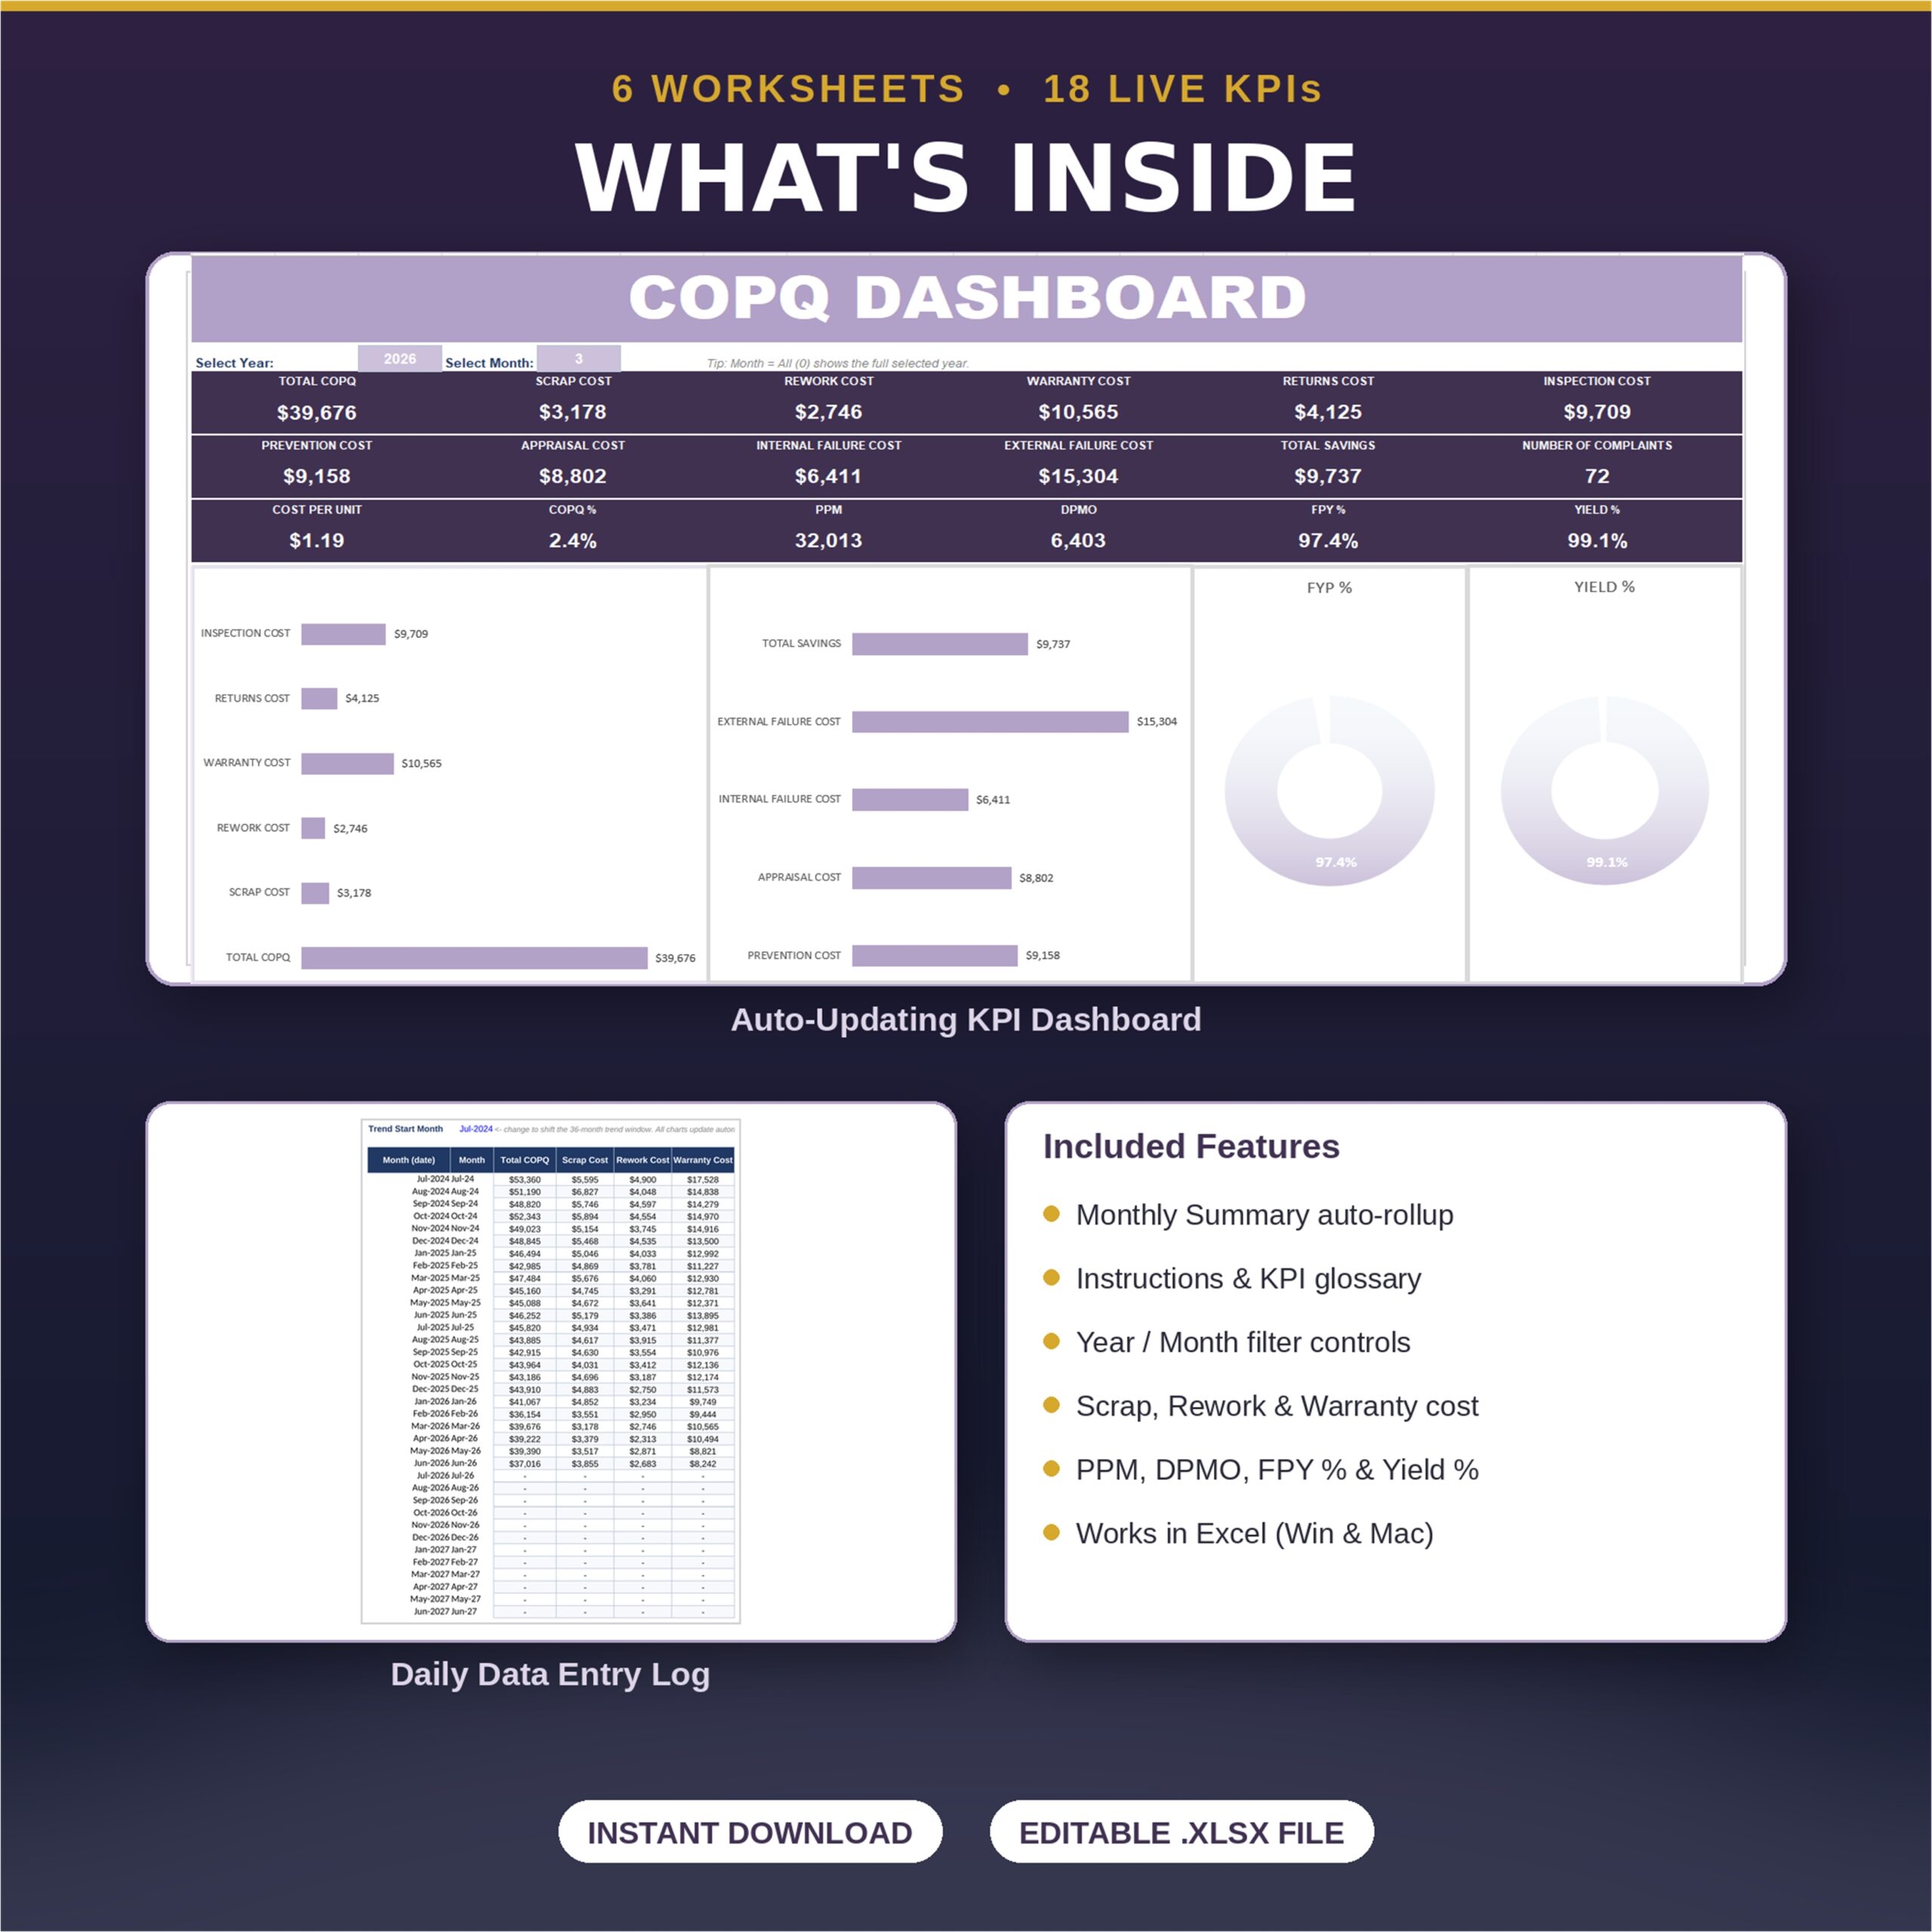
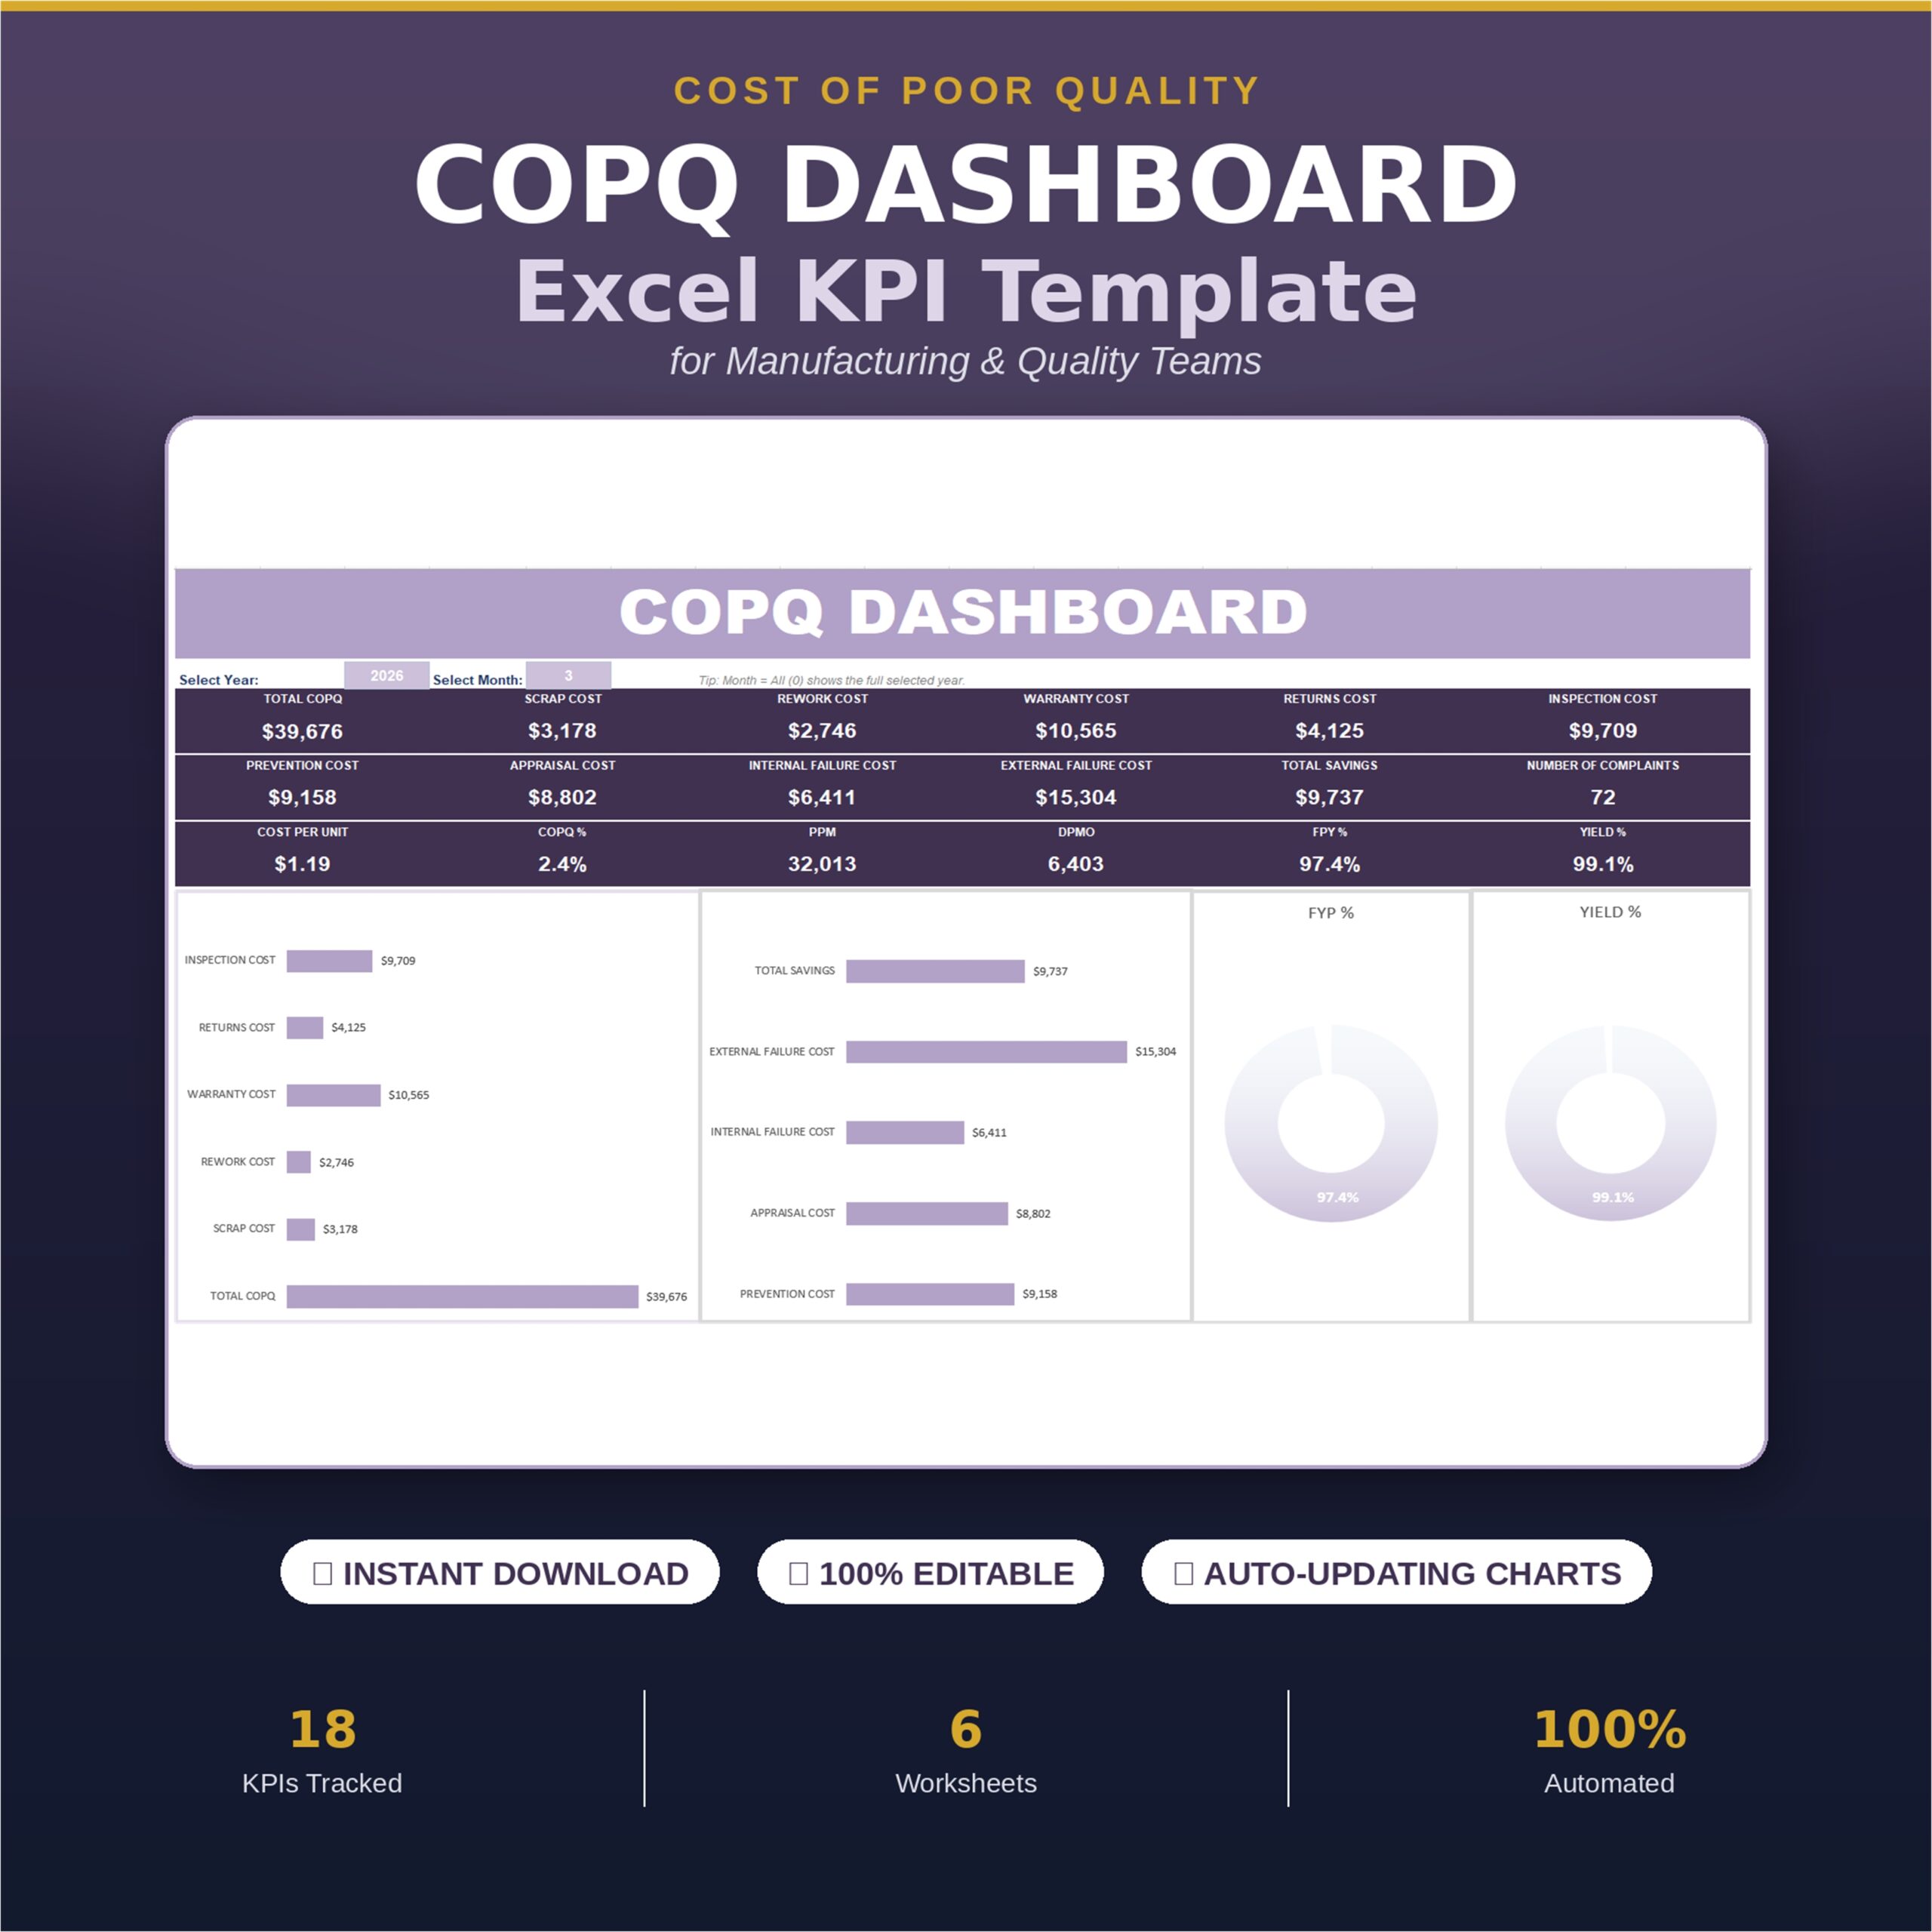
- Dashboard — a single-screen executive summary with 18 live KPI cards, a Year/Month filter, and automatically-updating charts.
- Daily Data Entry Log — a ready-to-use daily input sheet, pre-built for well over a year of entries. Blue cells are your inputs; black cells calculate themselves.
- Monthly Summary — silently rolls up your daily entries into a multi-year trend, feeding every chart on the dashboard.
- Instructions & KPI Glossary — a plain-English guide plus a definition for every metric, so any team member can use it without training.
- Sample data pre-loaded, so you can see exactly how the finished dashboard behaves before entering a single number of your own.
The 18 KPIs This Template Tracks Automatically
- Total COPQ (Cost of Poor Quality)
- Scrap Cost
- Rework Cost
- Warranty Cost
- Returns Cost
- Inspection Cost
- Prevention Cost
- Appraisal Cost
- Internal Failure Cost
- External Failure Cost
- Total Savings (quality improvement cost avoidance)
- Number of Complaints
- Cost Per Unit
- COPQ % (of production cost / revenue)
- PPM (Defects Per Million)
- DPMO (Defects Per Million Opportunities)
- FPY % (First Pass Yield)
- Yield % (final good-output yield)
These are the exact metrics quality managers report in monthly management reviews, and the exact baseline Six Sigma Green Belts and Black Belts need for a DMAIC project charter.
How It Works
- Log your day. Enter units produced, units scrapped, units reworked, defects found, and your cost figures — takes under two minutes.
- Everything calculates itself. Internal/External Failure Cost, Total COPQ, Cost Per Unit, COPQ%, PPM, DPMO, FPY%, and Yield% all calculate automatically.
- Your dashboard updates instantly. Pick a Year and Month on the Dashboard tab and every KPI card and chart refreshes to match — no rebuilding, no copy-pasting, no manual charting.
Who This Template Is For
- Quality Managers & Quality Engineers building monthly Cost of Quality reports
- Six Sigma Green Belts & Black Belts establishing a COPQ baseline for a DMAIC project
- Plant Managers & Operations Managers who need visibility into scrap, rework, and warranty spend
- Continuous Improvement / Lean teams tracking First Pass Yield and defect trends
- Small and mid-size manufacturers who want Cost-of-Quality visibility without an expensive QMS system
Technical Details
- File format: Microsoft Excel (.xlsx)
- Compatible with Excel 2016, 2019, 2021, Microsoft 365, and Excel for Mac
- No macros, no add-ins — 100% formula-based, safe on any company computer or network
- Instant digital download after purchase
Frequently Asked Questions
Do I need advanced Excel skills to use this? No. If you can type a number into a cell, you can use it. Input cells and formula cells are color-coded so you never overwrite a calculation by mistake.
Can I use this outside of manufacturing? Yes. While it’s built around manufacturing terms (units produced, scrap, rework), every label is editable, so service and process-based businesses can relabel it to fit their workflow.
Will the charts update automatically as I add more data? Yes — that’s the entire point of the template. Add a new day of data and every chart and KPI card updates itself immediately.
What happens when I reach the last pre-built row? Copy the last formula row and paste it into new rows below — formulas and formatting extend automatically.
Is this a one-time purchase? Yes. Pay once, keep the file forever, unlimited personal or internal business use.
Reviews
There are no reviews yet.