Description
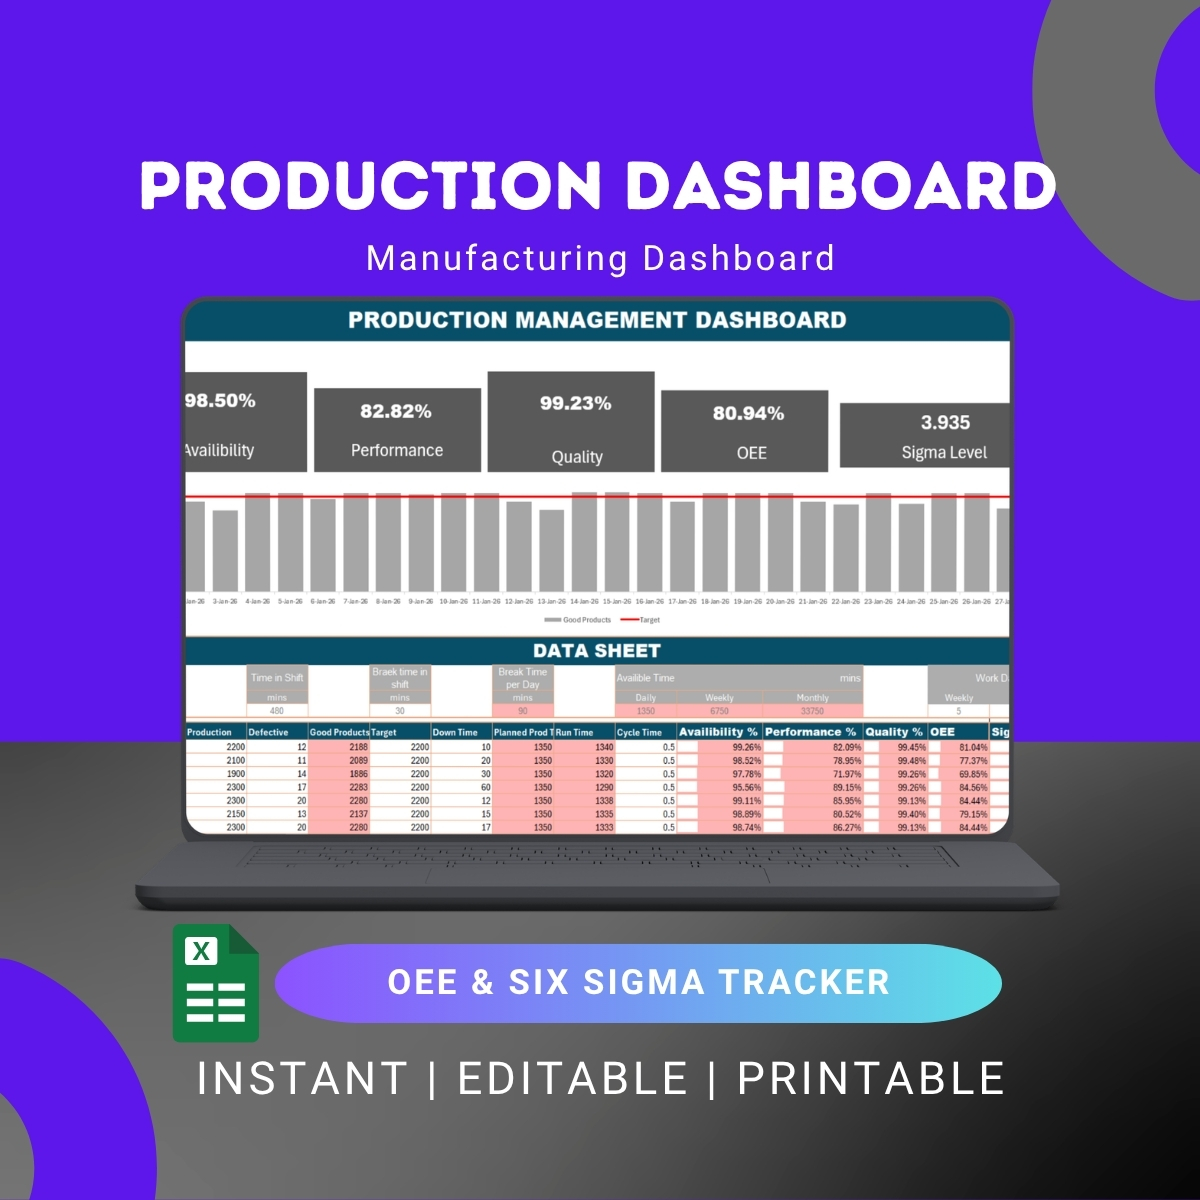
The OEE Excel Dashboard with Sigma Level — two KPIs every production team needs, in one file.
Most OEE Excel templates calculate Availability × Performance × Quality and stop there. But OEE alone doesn’t tell you the whole story of process performance. Sigma Level — the Six Sigma metric for defect rate — is what quality teams actually care about. This Production Management Dashboard combines both in a single, editable Excel file.
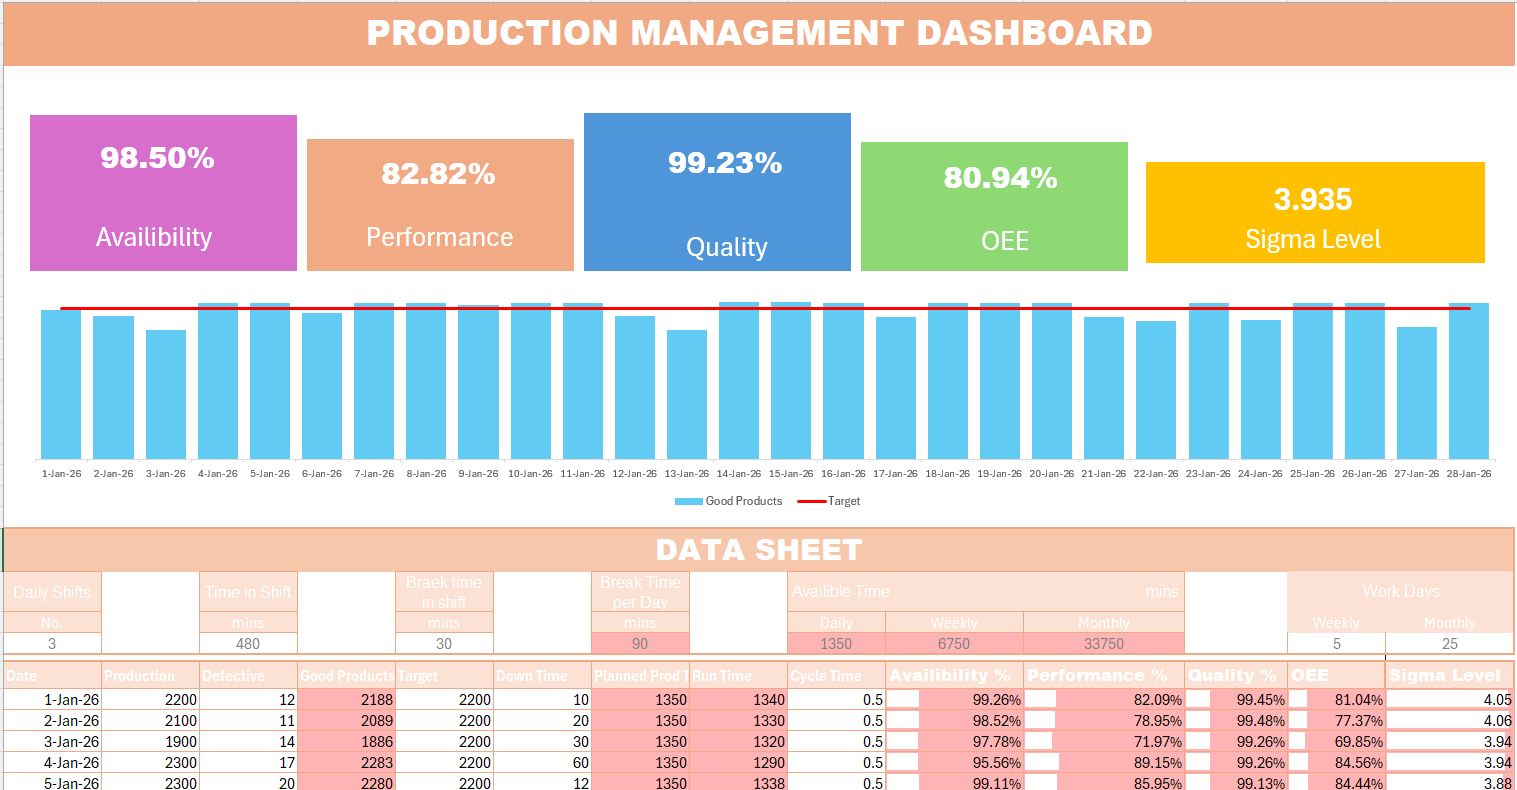
Enter your daily production data — output, defects, downtime, run time — and the dashboard automatically calculates Availability, Performance, Quality, OEE, and Sigma Level, then visualizes everything in a clean, presentable layout. No formulas to maintain. No macros to enable. No software to install. It’s the OEE Excel dashboard that finally gives production managers and Lean Six Sigma Belts the same view of the line.
What’s included in the OEE Excel Dashboard
📊 Automated KPI calculations
- Availability = Run Time ÷ Planned Production Time
- Performance = (Ideal Cycle Time × Total Count) ÷ Run Time
- Quality = Good Count ÷ Total Count
- OEE = Availability × Performance × Quality
- Sigma Level auto-calculated from defect rate (DPMO → Sigma)
- Downtime breakdown by reason
- Run Time vs planned time analysis
- Daily & monthly performance rollups
📈 Visual production dashboard
- OEE trend chart (daily and monthly)
- Availability / Performance / Quality breakdown
- Sigma Level trend visualization
- Downtime Pareto by reason
- Production output vs target chart
- Printable executive summary
📋 Data entry sheets
- Daily production log (output, good count, downtime, run time)
- Editable downtime reason codes
- Editable product / line / shift filters
- Target setting for OEE and Sigma Level
🎯 Reporting outputs
- One-page printable shift report
- Daily production review summary
- Monthly performance dashboard (executive view)
- Manufacturing KPI snapshot
Why this is different from a regular OEE Excel template
- Includes Sigma Level — the only widely-available OEE Excel template that calculates Six Sigma level alongside OEE. Lean Six Sigma Belts get both metrics in one view.
- Production-focused, not just equipment-focused — tracks the full production picture, not just one machine
- No macros required — opens cleanly in any Excel version, no security warnings, no enable-content prompts
- Daily AND monthly views — most templates only show one or the other
- Editable everything — colors, formulas, charts, reason codes, layout
Who this OEE Excel Dashboard is for
- Production managers running daily and monthly production reviews
- Manufacturing engineers tracking line efficiency and process performance
- Lean Six Sigma Green Belts and Black Belts who need OEE + Sigma Level together
- Factory supervisors doing shift handovers
- Operations and continuous improvement teams monitoring shop floor KPIs
- Industrial engineers building production reports
- Plant managers reporting OEE and quality metrics to leadership
- Six Sigma project owners measuring process baselines and improvements
- Consultants delivering Lean / Six Sigma engagements that need rapid measurement tools
OEE Excel Dashboard vs OEE Dashboard Online — which is right for you?
We offer two OEE solutions for two different needs:
- This OEE Excel Dashboard — best if you want an editable file you own forever, prefer working in Excel, want offline access, and need Sigma Level calculation alongside OEE. One-time payment, no subscription.
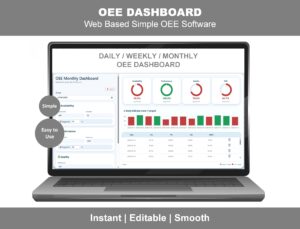
- OEE Dashboard Online — best if you want real-time monitoring across multiple devices, need shop-floor live displays, and want browser-based access from anywhere.
Many of our customers buy both — the Excel version for monthly reporting and Sigma Level tracking, and the online version for real-time shop-floor visibility.
Frequently asked questions
Q: Is this an Excel file or a web-based dashboard? A: This is an editable Microsoft Excel (.xlsx) file — fully offline, no installation, no internet required after download. If you want a web-based version, see our OEE Dashboard Online.
Q: Does the dashboard include Sigma Level calculation? A: Yes — and this is what makes it different from most OEE templates. Sigma Level is calculated automatically from your defect rate (using the standard DPMO → Sigma conversion). You get OEE and Sigma Level side-by-side in the same dashboard.
Q: Does it work in Excel for Mac? A: Yes. The dashboard uses standard Excel formulas with no macros, so it works in Excel for Windows, Mac, and Excel for Web.
Q: Are there any macros or VBA? A: No. The dashboard is 100% formula-driven — no macros, no VBA, no security warnings, no “enable content” prompts. It opens cleanly in any Excel version.
Q: How is Sigma Level calculated? A: The dashboard converts your defect rate into Defects Per Million Opportunities (DPMO), then uses the standard Six Sigma conversion to display Sigma Level (1σ to 6σ). All formulas are visible and editable if you want to adjust for your industry’s definition of “opportunity.”
Q: Can I track multiple production lines? A: Yes. The dashboard supports multiple lines, products, and shifts with filtering, and a consolidated plant-level view.
Q: What’s a good OEE and Sigma Level? A: World-class OEE is 85%. World-class Sigma Level is 6σ (3.4 defects per million opportunities). Most discrete manufacturers operate at 60–75% OEE and around 3σ–4σ. The dashboard shows benchmarks so you can see where you stand.
Q: Can I customize downtime reason codes? A: Yes — the reason code library is fully editable. Add, remove, or rename codes to match your operation.
Q: How do I receive the file after purchase? A: Instant download link by email immediately after checkout. The file is also available in your account area.
Q: Refund policy? A: 7-day money-back guarantee — if it’s not the right fit, contact us for a full refund.
Related Lean and production tools
If you’re tracking OEE and production KPIs, these companion products work well together:
- OEE Dashboard Online — web-based real-time OEE monitoring
- Maintenance KPI Dashboard — downtime, work orders, and maintenance metrics
- MTBF & MTTR Dashboard — equipment reliability tracking
- Autonomous Maintenance Dashboard — TPM jishu hozen tracker
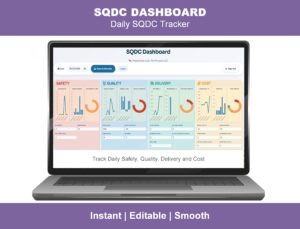
- SQDC Dashboard — daily Lean tier board
- DMAIC Toolkit — full Lean Six Sigma project toolkit
- VSM Excel Template — current-state Value Stream Mapping
Click “Add to cart” above to download the OEE Excel Dashboard with Sigma Level — instant access.
Reviews
There are no reviews yet.