Description
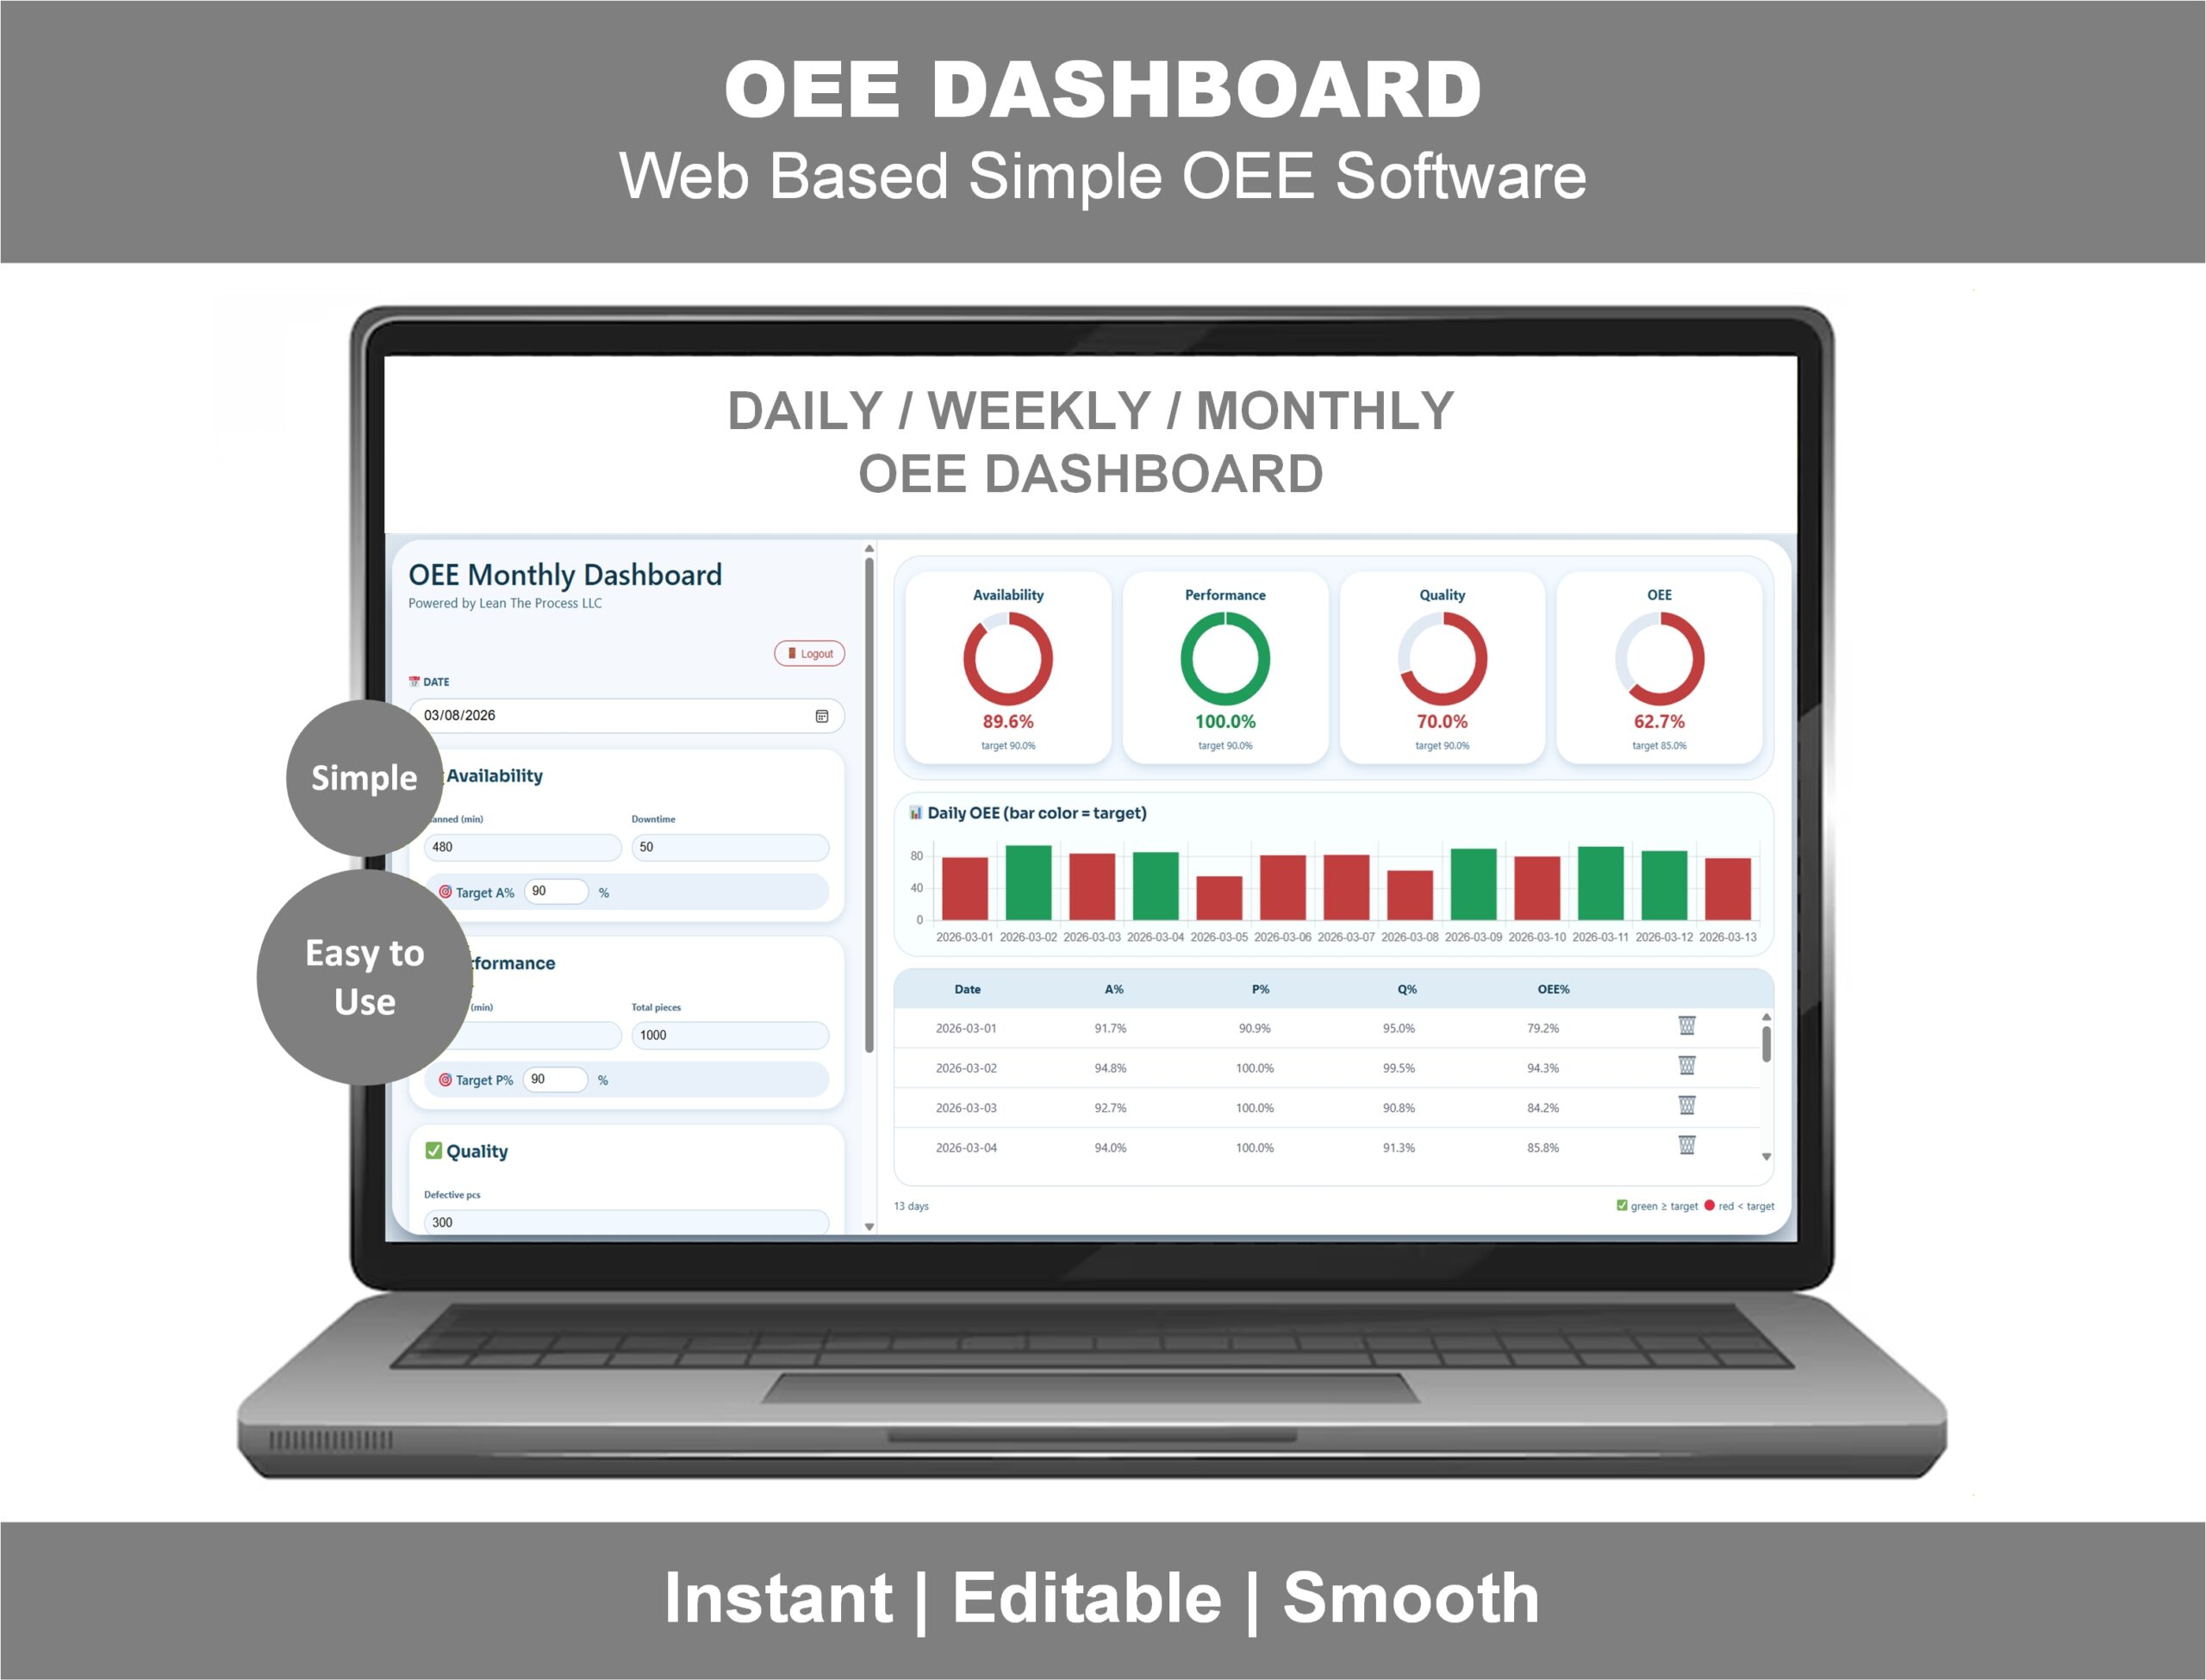
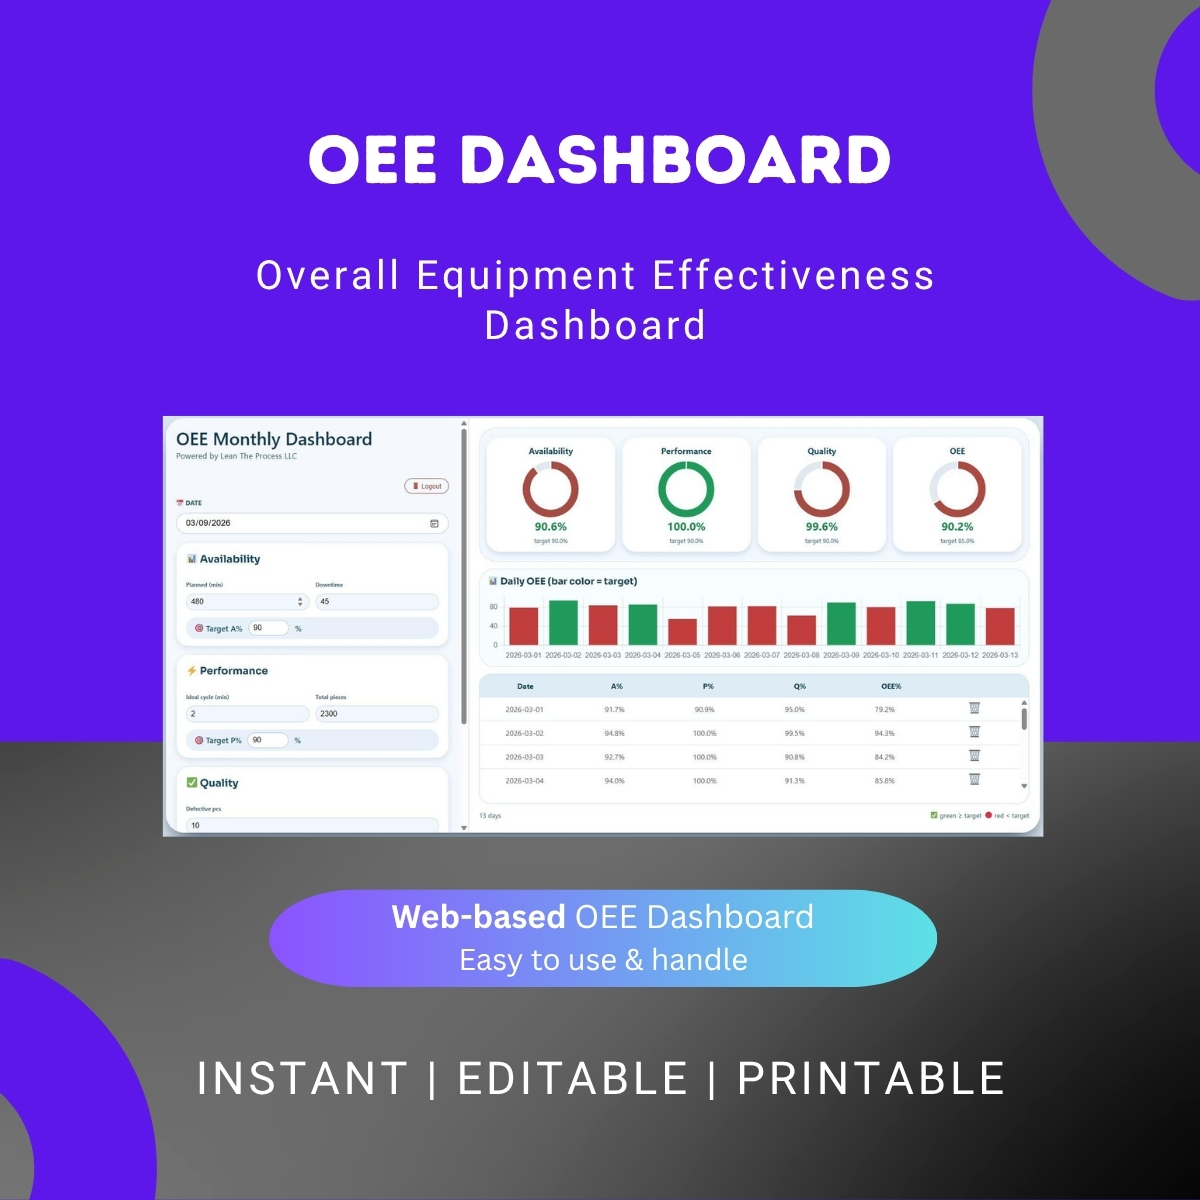
The web-based OEE Dashboard manufacturers actually use — without the MES price tag.
Most production teams want OEE visibility but can’t justify a six-figure manufacturing execution system. Excel templates work for monthly reporting but can’t track equipment effectiveness in real time. This OEE Dashboard solves both problems — it’s a fully web-based Overall Equipment Effectiveness platform that runs in any browser, calculates Availability × Performance × Quality automatically, and gives plant managers a live view of OEE from any device. No installation. No SaaS subscription lock-in. No Excel formulas to maintain.
Whether you’re tracking one line or a multi-plant operation, the OEE Dashboard online gives you the same real-time insight that enterprise OEE software provides — at a fraction of the cost.
What the OEE Dashboard does for you
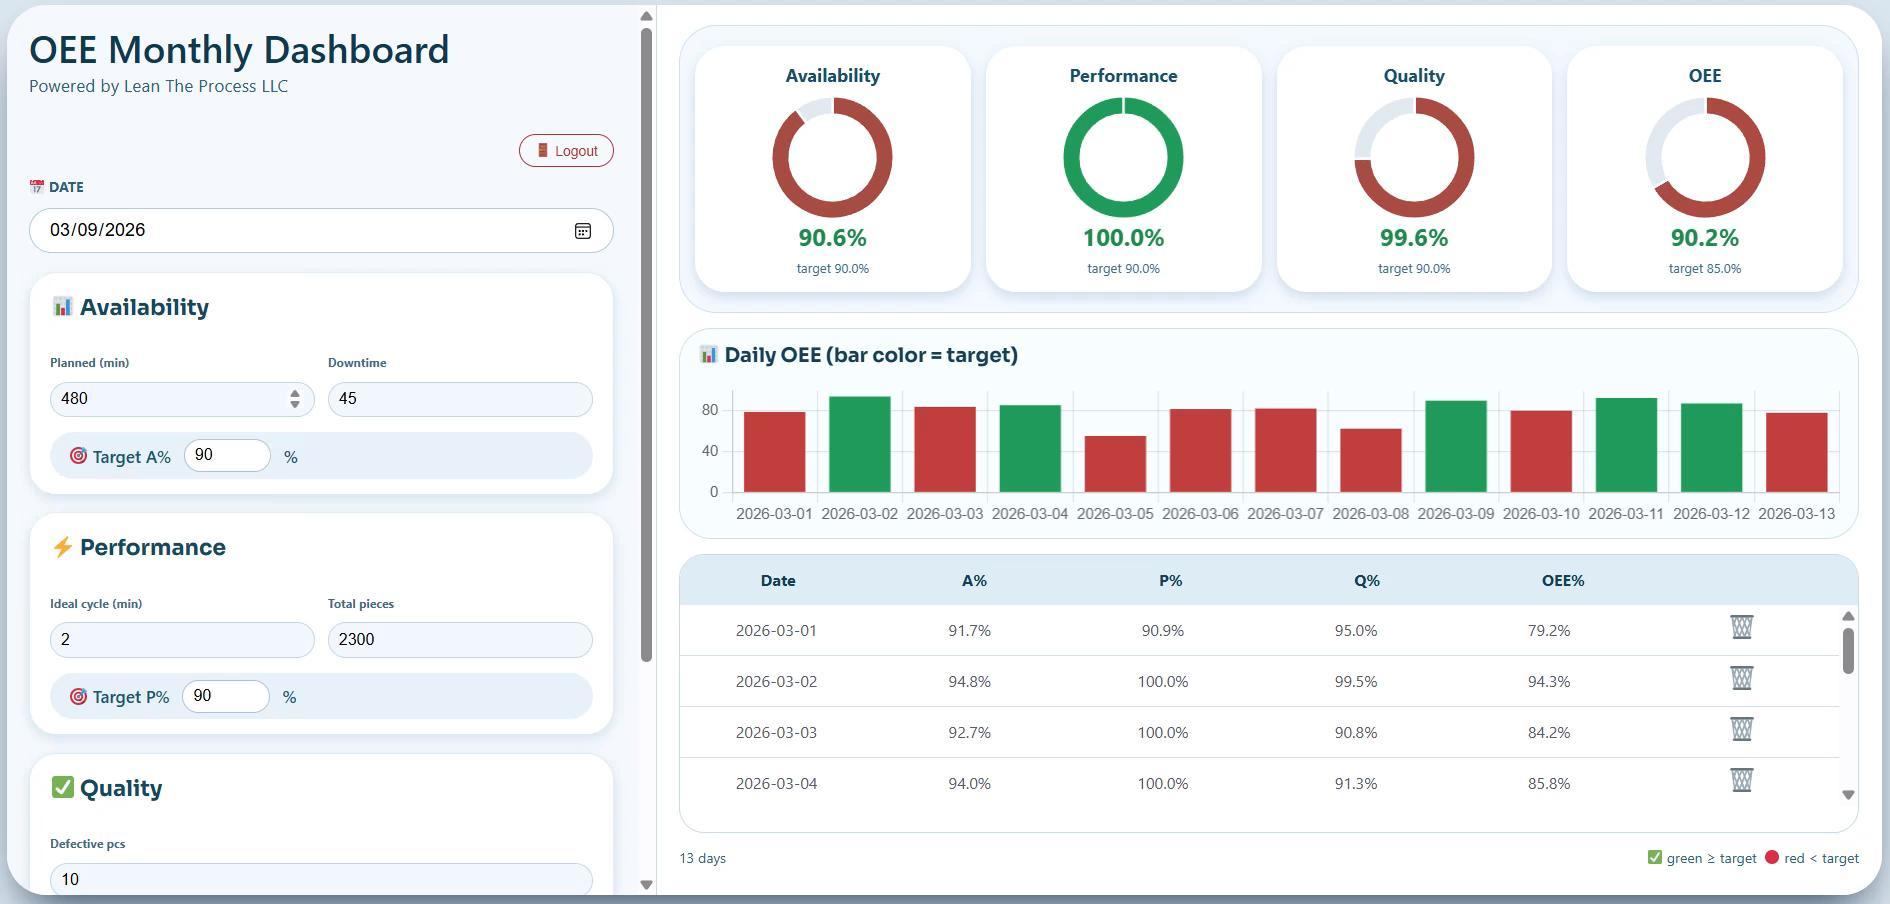
📊 Real-time OEE monitoring
- Live OEE tracking from any browser-connected device
- Instant calculation of Availability, Performance, and Quality
- OEE = Availability × Performance × Quality updated in real time
- World-class benchmark line (85% target)
- Drill-down by line, shift, day, or production run
📈 Visual KPI dashboard
- Daily, weekly, and monthly OEE trend charts
- Availability, Performance, Quality breakdown
- Six Big Losses Pareto chart (downtime, setup, micro-stops, speed loss, scrap, rework)
- Top downtime reasons by frequency and duration
- Line-by-line and shift-by-shift comparison
🎯 Production loss identification
- Automatic detection of downtime, speed loss, and quality defects
- Loss categorization across the Six Big Losses framework
- Quick identification of the highest-impact bottleneck
- Trends over time so you can see if improvements are sticking
🌐 Web-based access (no installation)
- Works in any modern browser (Chrome, Edge, Safari, Firefox)
- Accessible from desktop, laptop, tablet, or shop-floor display
- No Excel skills required, no software install, no IT approval needed
- Cross-device — view the same dashboard in the office and on the line
🛠️ Practical features for production teams
- Customizable downtime reason codes
- Customizable reject reason codes
- Multiple line / multiple machine support
- Shift handover view
- Printable executive summary
Who this OEE Dashboard online is for
- Production and manufacturing engineers tracking line efficiency in real time
- Plant managers and operations directors needing live OEE visibility
- Continuous improvement and Lean practitioners running OEE-driven projects
- Maintenance managers correlating OEE with downtime and breakdowns
- Six Sigma Green Belts and Black Belts using OEE as a project KPI
- Operational excellence teams standardizing OEE across multiple lines or plants
- Lean and manufacturing consultants delivering OEE implementations
Why this OEE Dashboard beats Excel and beats expensive MES software
vs Excel OEE templates:
- Real-time updates — Excel can’t refresh on its own
- Multi-user — multiple people can view the same live dashboard
- No formulas to break — calculations are baked in
- Accessible from the shop floor on any device
vs full MES / enterprise OEE software:
- A fraction of the cost — one-time payment, not a per-line subscription
- No multi-month implementation project
- No vendor lock-in
- No IT integration headaches
- You can be using it the day you buy it
Frequently asked questions
Q: Is this an Excel file or a web-based dashboard? A: This is a web-based OEE Dashboard — it runs entirely in your browser. There’s nothing to install or download. After purchase, you receive instant access and can use it on any device with a browser.
Q: Does the dashboard track OEE in real time? A: Yes. Once you enter or feed in production data, the dashboard updates Availability, Performance, Quality, and OEE in real time. You can keep it open on a shop-floor display for live monitoring.
Q: How is OEE calculated? A: The standard OEE formula — Availability × Performance × Quality. Each component is calculated automatically from your production inputs (planned production time, downtime, output, and good count).
Q: Can I track multiple production lines? A: Yes. The dashboard supports multiple lines and machines, with line-by-line filtering and a consolidated plant-level view.
Q: Do I need to integrate it with my machines or sensors? A: No integration is required to get started. You can enter production data manually (great for plants without IoT sensors) or set up data feeds if you have them. The dashboard works either way.
Q: What’s a good OEE score? A: World-class OEE is 85% (Availability 90% × Performance 95% × Quality 99.9%). Most discrete manufacturers operate between 60% and 75%. The dashboard includes a benchmark line so you can see where you stand against world-class.
Q: Can I customize downtime and reject reason codes for my industry? A: Yes. Reason code libraries are fully customizable — add, remove, or rename codes to match your specific operation.
Q: What devices and browsers does it work on? A: Any modern browser on Windows, Mac, iPad, Android tablet, or smartphone. Tested in Chrome, Edge, Safari, and Firefox.
Q: Will the dashboard work for my industry? A: It’s designed for any process where you have planned production time, downtime, output, and reject data — discrete assembly, food and beverage, pharma, automotive, packaging, electronics, and process industries all work.
Q: Is this a subscription or a one-time purchase? A: One-time purchase with ongoing access — not a subscription. You pay once and use it.
Q: How do I access the OEE Dashboard online after purchase? A: You’ll receive an instant access link by email immediately after checkout. The link is also available in your account area. No download, no install — click and use.
Q: Is there a refund policy? A: Yes — 7-day money-back guarantee. If it’s not the right fit, contact us for a full refund.
Related Lean tools you may need
If you’re tracking OEE, these companion products are commonly used together:
- VSM Analysis Tool Online — web-based VSM with automated bottleneck detection
- Production Management Dashboard — output, scrap, and Sigma-level tracking
- Maintenance KPI Dashboard — downtime and work orders
- MTBF & MTTR Dashboard — equipment reliability metrics
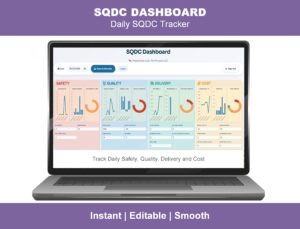
- SQDC Dashboard — daily Lean tier board
- Autonomous Maintenance Dashboard — TPM jishu hozen tracker
Click “Add to cart” above for instant access to the OEE Dashboard.
Reviews
There are no reviews yet.