Description
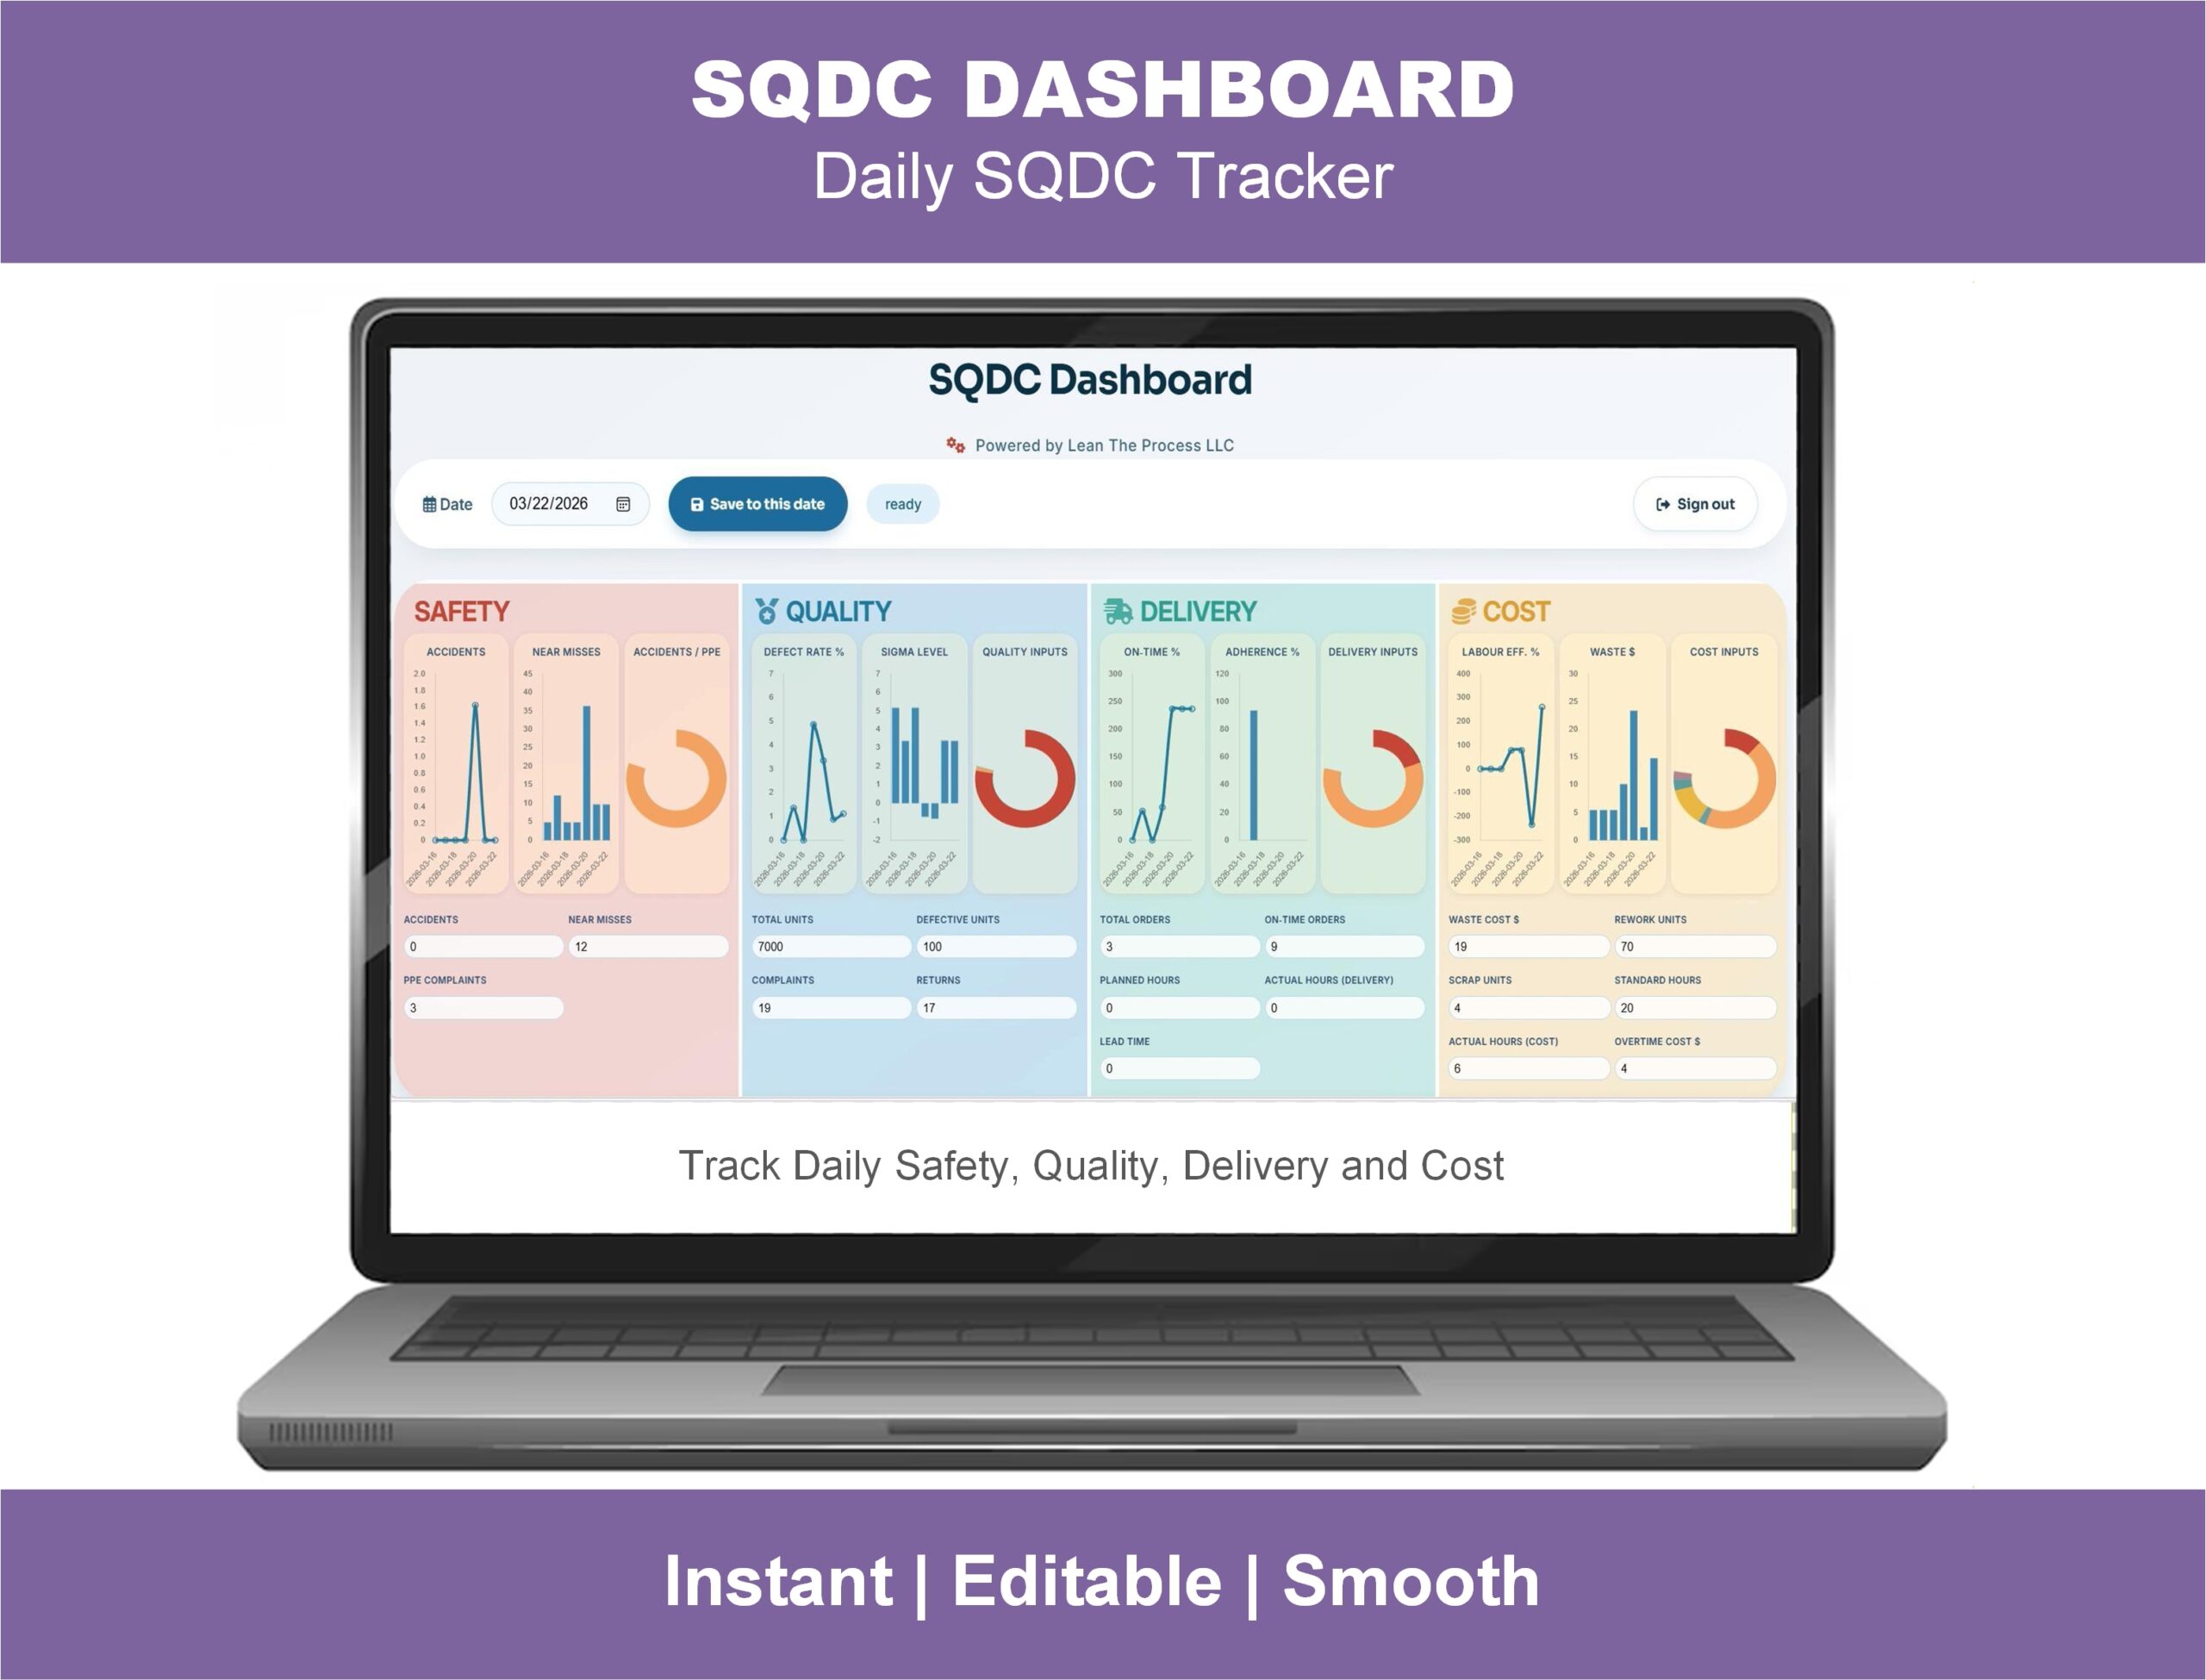
The digital SQDC dashboard that finally makes your tier meeting worth showing up to.
Every Lean factory has an SQDC board. Most of them are whiteboards covered in faded sticky notes, with KPIs that haven’t been updated since Tuesday and incident counters that nobody trusts. The daily tier meeting drags on. People stop showing up. The “system” dies quietly.
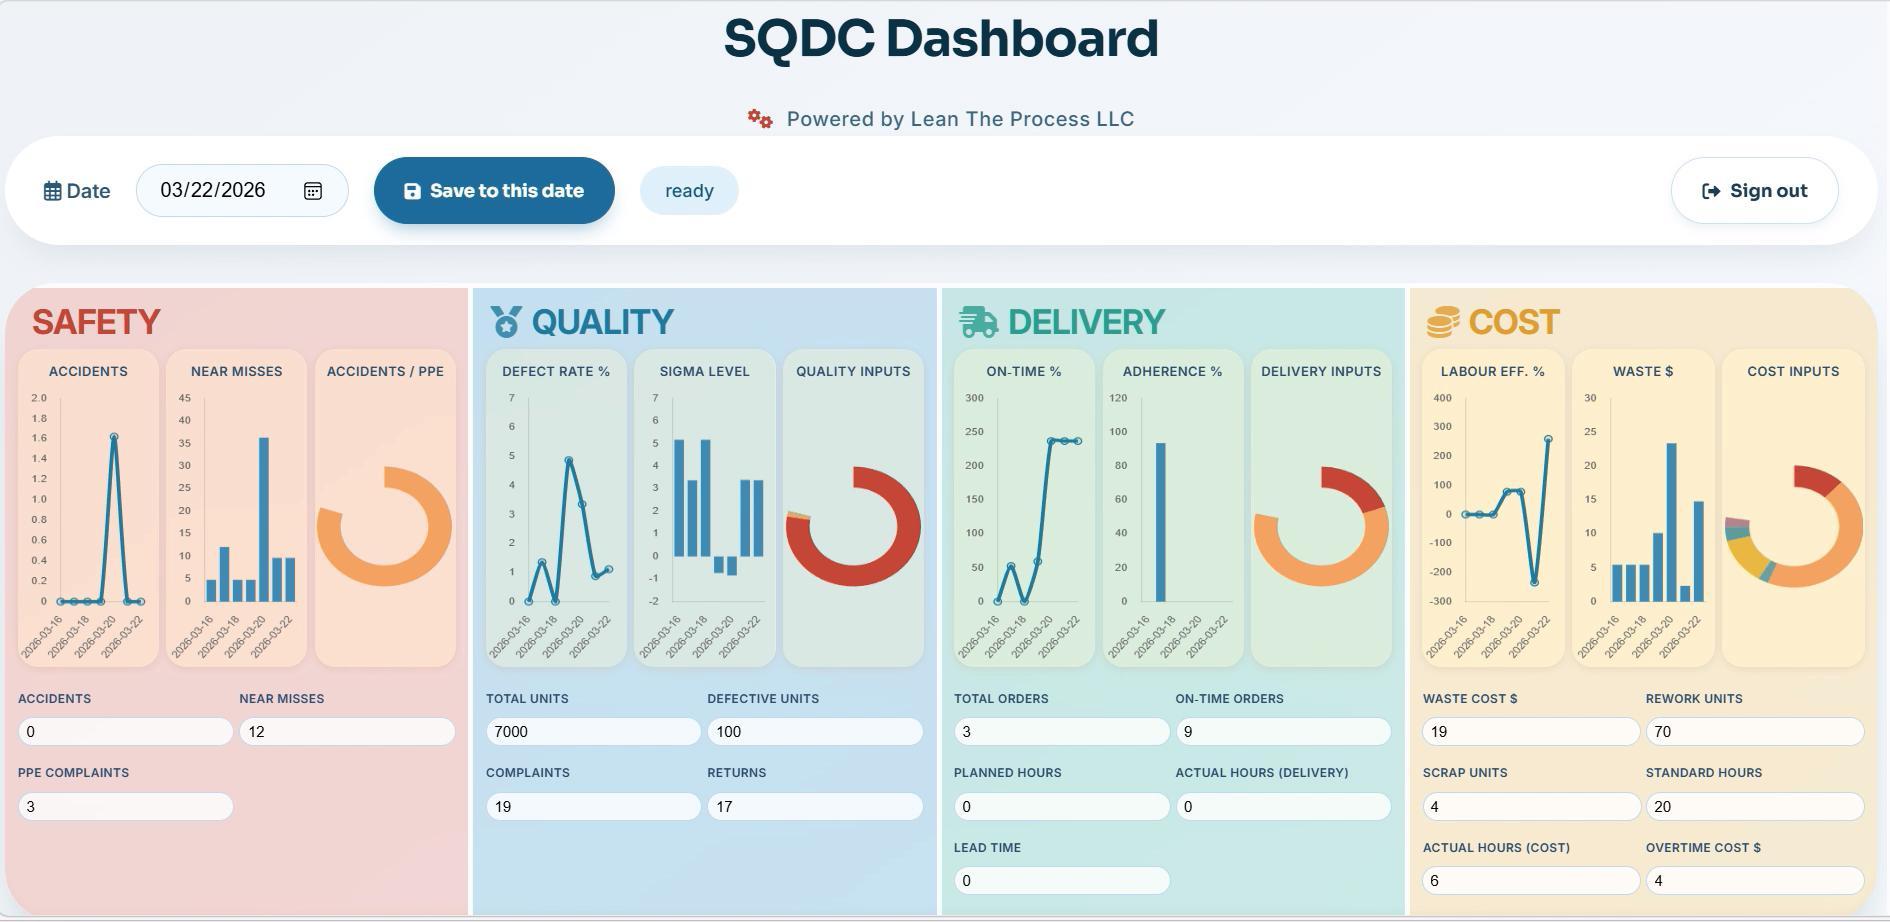
This web-based SQDC Dashboard fixes that. Safety, Quality, Delivery, and Cost — your four core operational KPIs — are tracked live in a clean, interactive dashboard accessible from any device. Project it on the shop-floor screen for your morning huddle. Pull it up on a tablet on the line. Review it on your phone before walking into the daily review. Real-time numbers, real-time accountability, real-time conversation about what to fix today.
No software to install. No Excel formulas to babysit. No SaaS subscription draining the budget. One-time purchase, lifetime access — and you can be running your next tier meeting with it tomorrow.
What the SQDC Dashboard does for your operation
🛡️ Safety — track what matters before someone gets hurt
- Days since last incident counter (the visual heart of any SQDC board)
- Lost Time Injury (LTI) tracking
- Near-miss reporting and trend
- Safety observation count
- Compliance indicator status
- Incident-by-area heat map
🎯 Quality — see defects before they reach the customer
- Defect rate (PPM / DPMO)
- Scrap and rework tracking
- First Pass Yield
- Top defect Pareto chart
- Quality trend over rolling 30 days
- Customer complaint count
🚚 Delivery — keep promises and protect customer trust
- On-Time Delivery percentage
- Schedule adherence
- Production output vs target
- Late order tracker
- Backlog status
💰 Cost — turn waste into a number leadership can act on
- Cost per unit produced
- Material waste percentage
- Overtime hours and cost
- Energy consumption trend
- Operational cost vs budget
🌐 Real-time, web-based, anywhere
- Runs in any modern browser (Chrome, Edge, Safari, Firefox)
- Works on desktop, laptop, tablet, large shop-floor display, and phone
- No installation, no plugin, no IT approval needed
- Multiple team members can view the same live dashboard simultaneously
- Project it in the morning huddle — refresh and the numbers are current
Why this beats your current SQDC system
vs your whiteboard SQDC board
- Always current — no more arguing about whether the numbers got updated
- Visible everywhere — anyone on any shift can pull it up
- Trends built in — whiteboards show today; this dashboard shows the trajectory
- No marker smell, no faded ink, no missing magnets
vs Excel SQDC templates
- Real-time — Excel can’t update on its own
- Multi-user — multiple people can view live, no “who has the file open” problem
- No formulas to break — calculations are baked in
- Mobile-friendly — Excel on a phone is painful; this is built for shop-floor displays
vs enterprise MES / SQDC software (Worximity, Tulip, Andon platforms)
- A fraction of the cost — one-time payment, not a per-line monthly fee
- No 6-month implementation — running today, not next quarter
- No vendor lock-in
- No IT integration project
Built for these roles
- Plant managers and operations directors running daily tier reviews
- Production supervisors owning the shop-floor SQDC board
- Lean Six Sigma Black Belts and Green Belts running OpEx programs
- Continuous improvement managers standardizing tier boards across multiple lines or sites
- Industrial and manufacturing engineers rebuilding broken SQDC systems
- Quality and safety managers wanting visibility on their KPIs in a shared view
- Lean consultants delivering tier-meeting and visual-management implementations
What makes the daily SQDC tier meeting actually work
The point of an SQDC board isn’t to display KPIs — it’s to drive a 15-minute daily conversation that ends with clear actions. This dashboard is built to support that conversation:
- At-a-glance status — every metric color-coded green / amber / red
- Drill-down where needed — click a red KPI to see why
- Action capture — tie countermeasures to specific KPIs
- Cross-shift continuity — what got escalated yesterday is visible today
If your SQDC board has become decorative wallpaper, this is what brings it back to life.
Frequently asked questions
Q: Is this an Excel file or a web-based dashboard? A: This is a web-based dashboard — it runs entirely in your browser. There’s nothing to download or install. After purchase, you receive instant access and can use it on any device with a modern browser.
Q: How is this different from a whiteboard SQDC board? A: A whiteboard shows today’s numbers if someone remembered to update them. This dashboard updates in real time, shows trends, is visible on every device, and survives shift changes and weekend gaps. The Lean philosophy of visual management is preserved — the manual labor of keeping it current is removed.
Q: Can I project it on a shop-floor display for the daily tier meeting? A: Yes — that’s the primary use case. Project it on a TV or monitor in the meeting area, refresh it before the huddle, and lead the conversation directly off the dashboard.
Q: Does it work on tablets and phones? A: Yes. The dashboard is fully responsive — works on iPad, Android tablets, and phones. Many customers use it on tablets for the gemba walk so the team can review SQDC at the line itself.
Q: How is data entered into the dashboard? A: You enter data through the dashboard’s input forms — no separate software needed. Data entry takes 2–5 minutes per shift for most operations. Some customers also import production data from their existing systems.
Q: Does it support multiple lines or multiple plants? A: Yes. The dashboard supports multi-line and multi-area views, with a consolidated plant-level rollup.
Q: Can I customize the SQDC categories or KPIs? A: Yes. Add or rename KPIs within Safety, Quality, Delivery, and Cost. Some customers also extend it to SQDCP (adding People) or SQDCM (adding Morale) — both are supported.
Q: Is this a one-time purchase or a subscription? A: One-time purchase with ongoing access — not a subscription. You pay once and use it.
Q: How quickly can I be running tier meetings off this dashboard? A: Most customers go from purchase to first tier meeting in under 24 hours. Setup is a one-page configuration (your KPIs, your targets, your line names) — no implementation project.
Q: How do I access the SQDC Dashboard after purchase? A: Instant access link by email immediately after checkout. Setup instructions and a quick-start guide are included.
Q: Refund policy? A: 7-day money-back guarantee. If it’s not the right fit, contact us for a full refund.
Related Lean tools
If you’re running a tier-meeting or visual-management program, these companion products work well together:
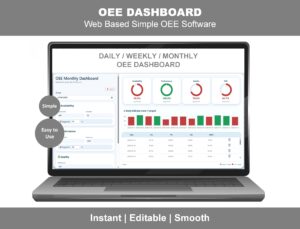
- OEE Dashboard Online — web-based real-time OEE monitoring (drill-down for the Quality / Delivery KPI)
- VSM Analysis Tool Online — web-based Value Stream Mapping with bottleneck detection
- Production Management Dashboard Excel — OEE + Sigma Level Excel template
- Maintenance KPI Dashboard — supports the Cost / Delivery KPI on SQDC
- A3 Problem Solving Template — for the countermeasure documentation behind any red SQDC KPI
- DMAIC Toolkit — full Lean Six Sigma project toolkit for tackling SQDC issues
Click “Add to cart” above for instant access to the SQDC Dashboard. Run your next tier meeting from a real dashboard, not a faded whiteboard.
Reviews
There are no reviews yet.