Description
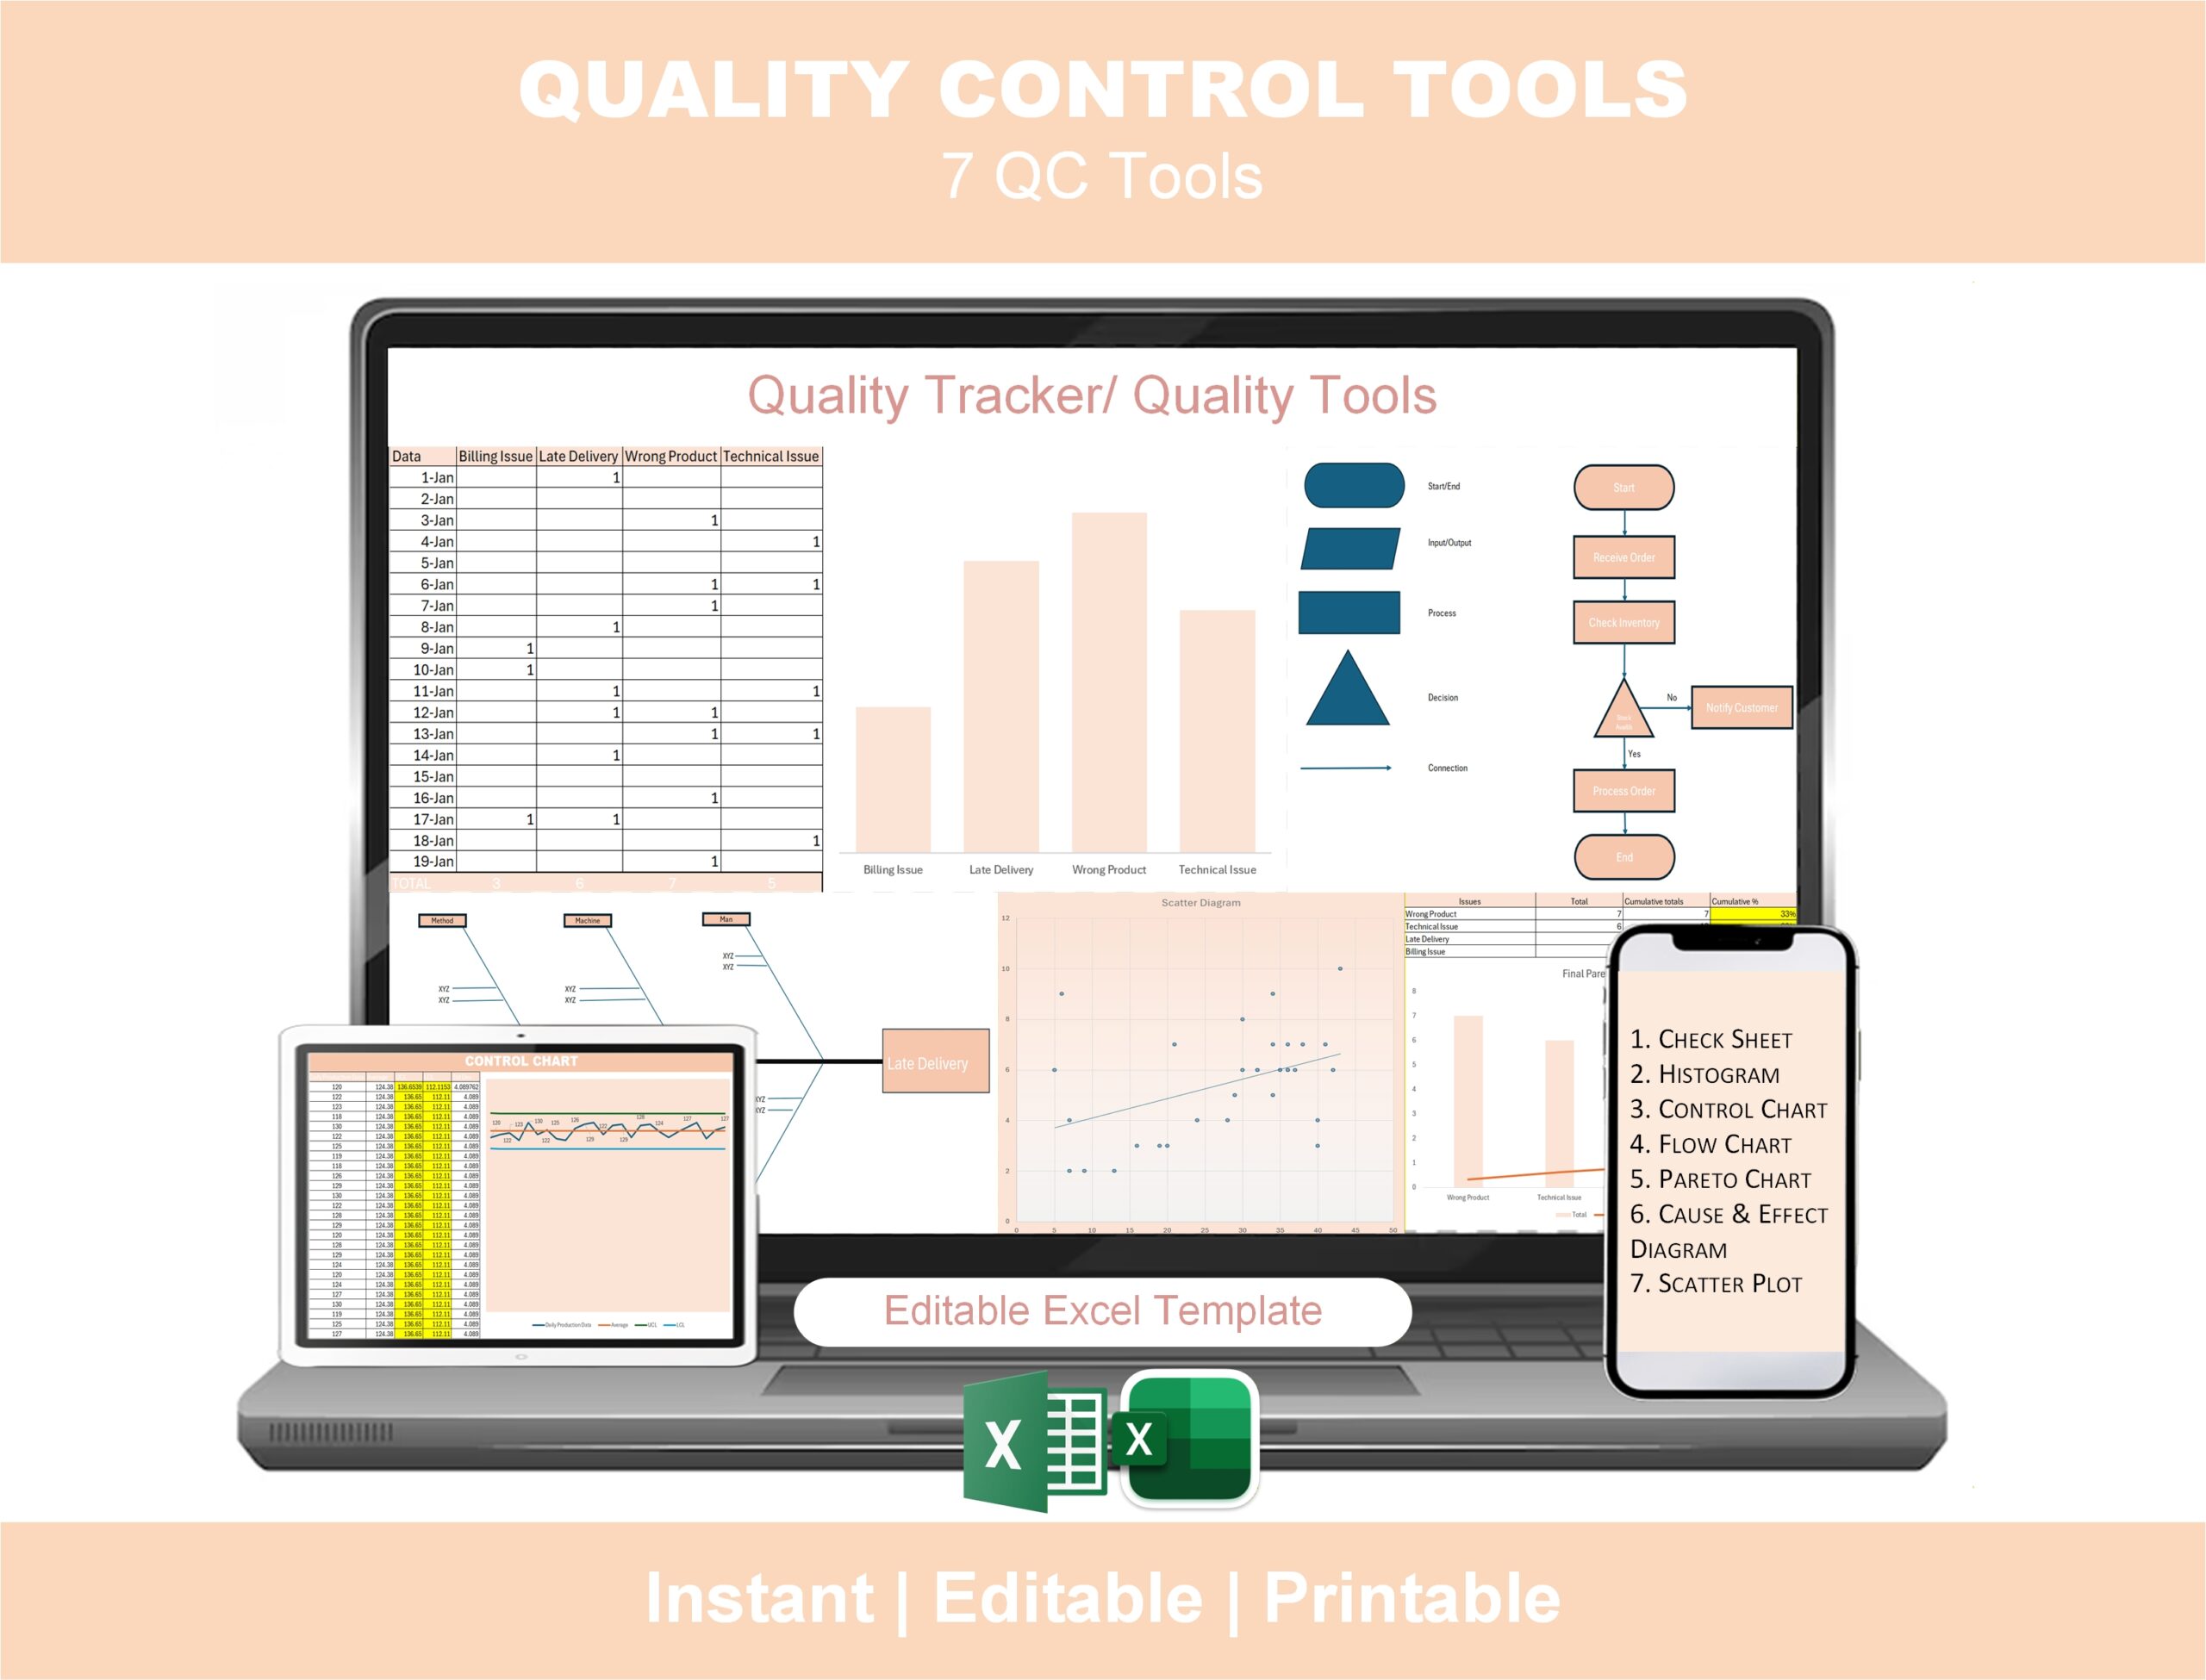
The complete 7 QC Tools excel templates, in one editable Excel file.
The Seven Basic Quality Control Tools are the foundation of every Lean Six Sigma quality program — and every Green Belt and Black Belt exam. The challenge most quality professionals and students face isn’t understanding the tools. It’s having clean, editable, presentation-ready versions of each one when you actually need them. This 7 QC Tools Excel Template solves that problem permanently.
All seven tools — Check Sheet, Histogram, Control Chart, Flow Chart, Pareto Chart, Fishbone (Cause-and-Effect) Diagram, and Scatter Plot — are pre-built in a single Excel workbook with automated formulas and charts. Enter your data and the tools produce professional, dashboard-quality output ready to drop into a Lean Six Sigma project, a Green Belt exam, or a quality presentation to leadership.
What’s included — the complete 7 QC Tools
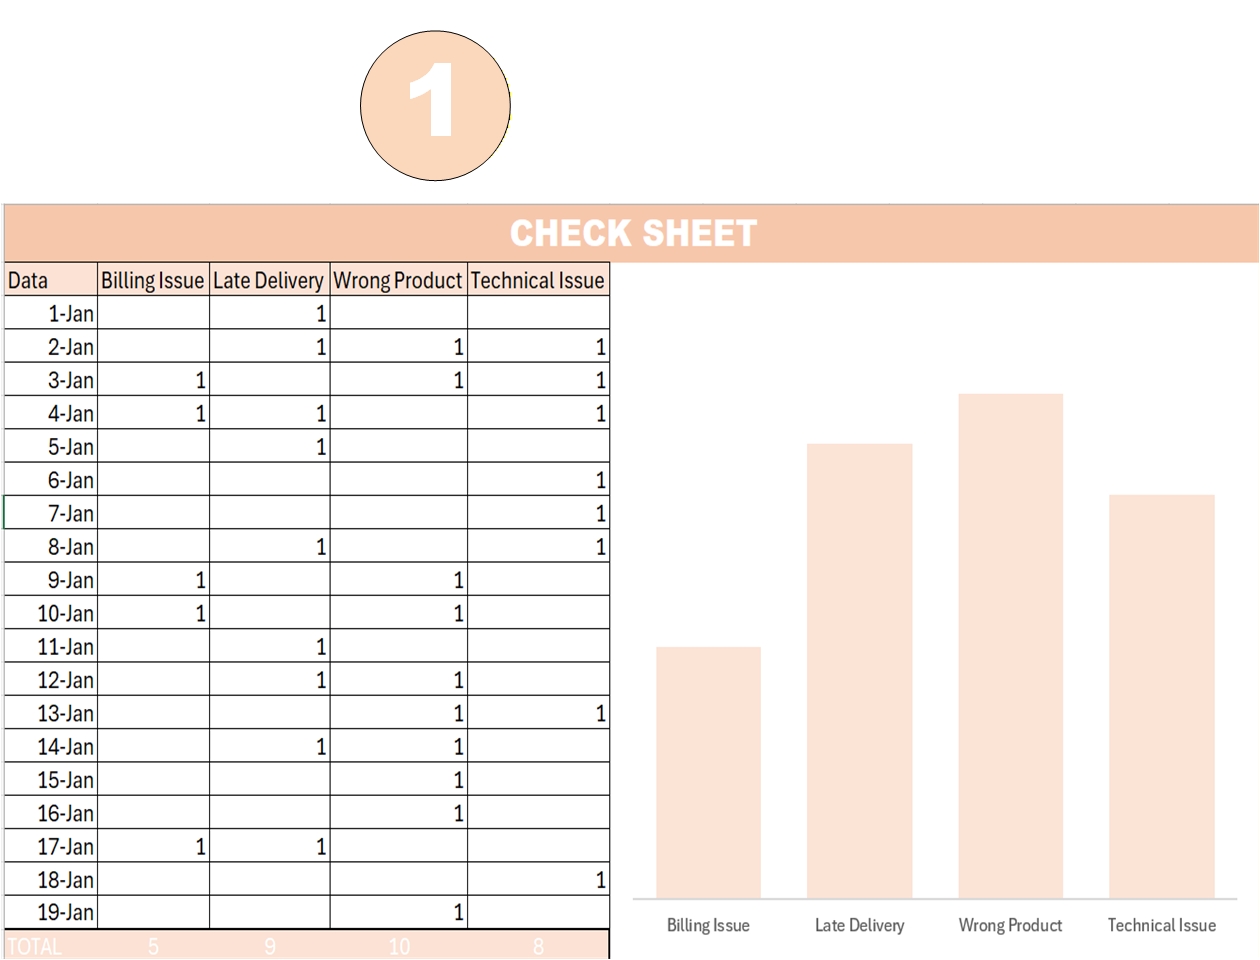
1. ✅ Check Sheet (Data Collection Template)
The starting point of any quality study. Pre-built tally sheet for collecting defect data, with categories, frequency counts, and date stamps.
2. 📊 Histogram (Frequency Distribution Analysis)
Auto-generated frequency distribution from your data, with bin sizing, normal curve overlay, and process capability visualization.
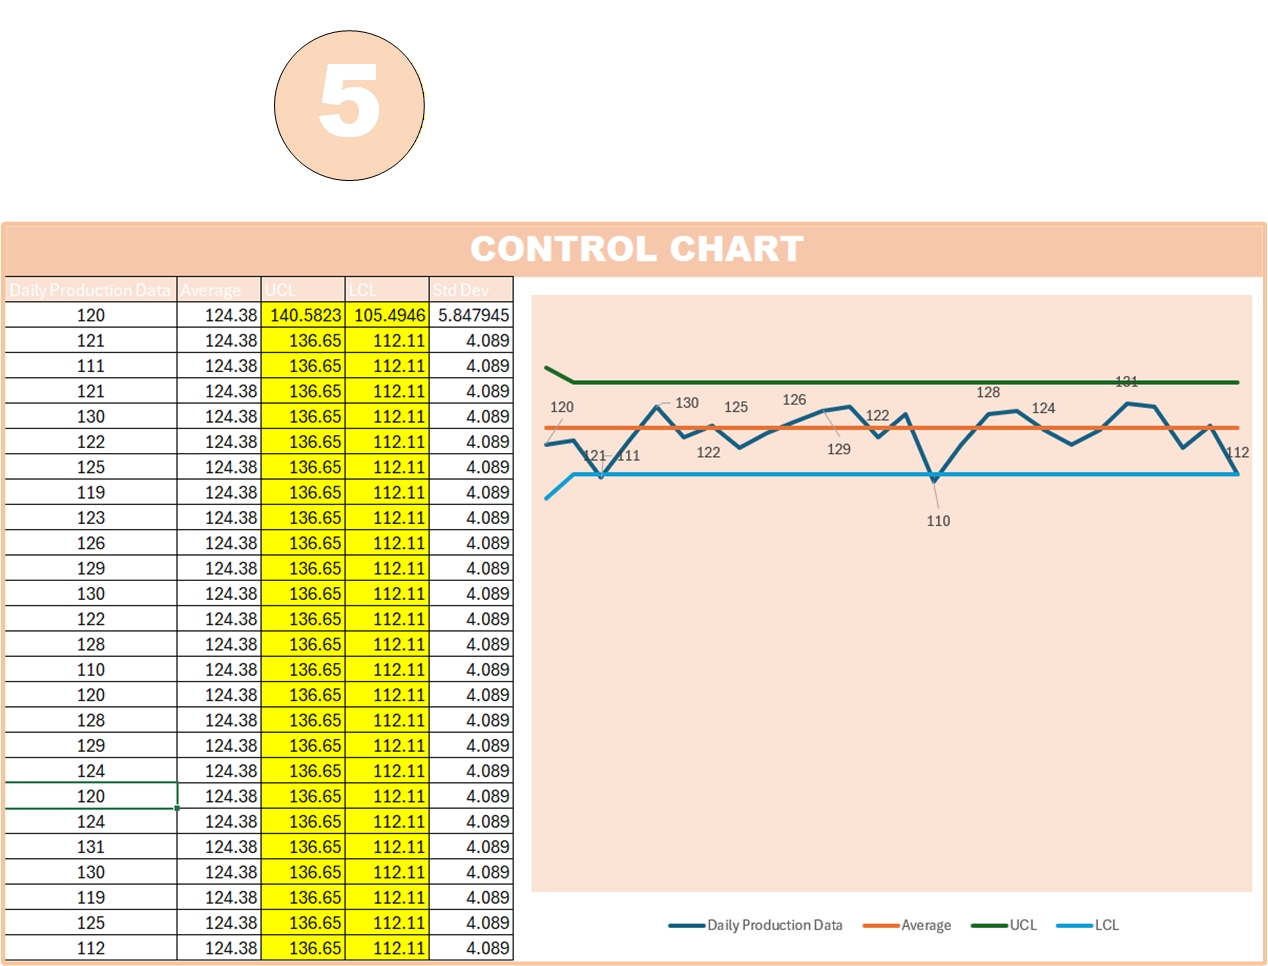
3. 📈 Control Chart (Process Stability Monitoring)
Includes X-bar / R chart with upper and lower control limits calculated automatically. Identifies special-cause variation at a glance.
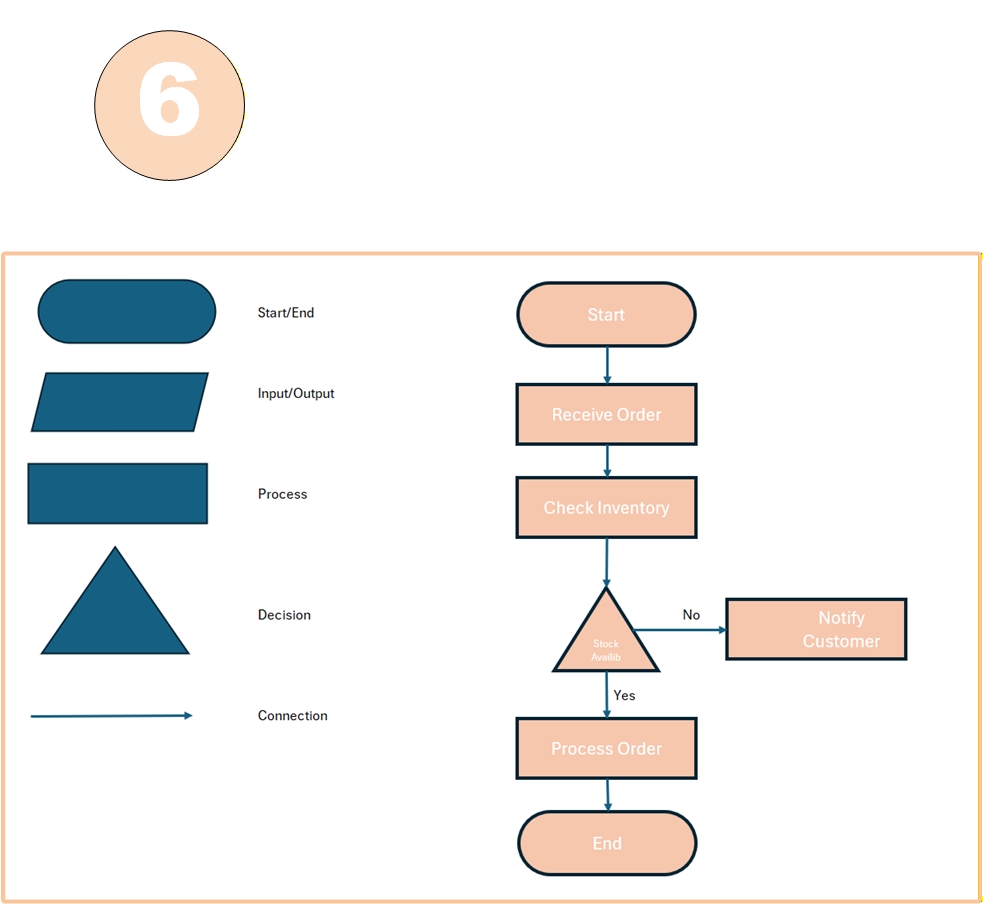
4. 🔀 Flow Chart (Process Visualization)
Editable process flow diagram with standard flowchart symbols — start/end, decision diamonds, process boxes, and connectors.
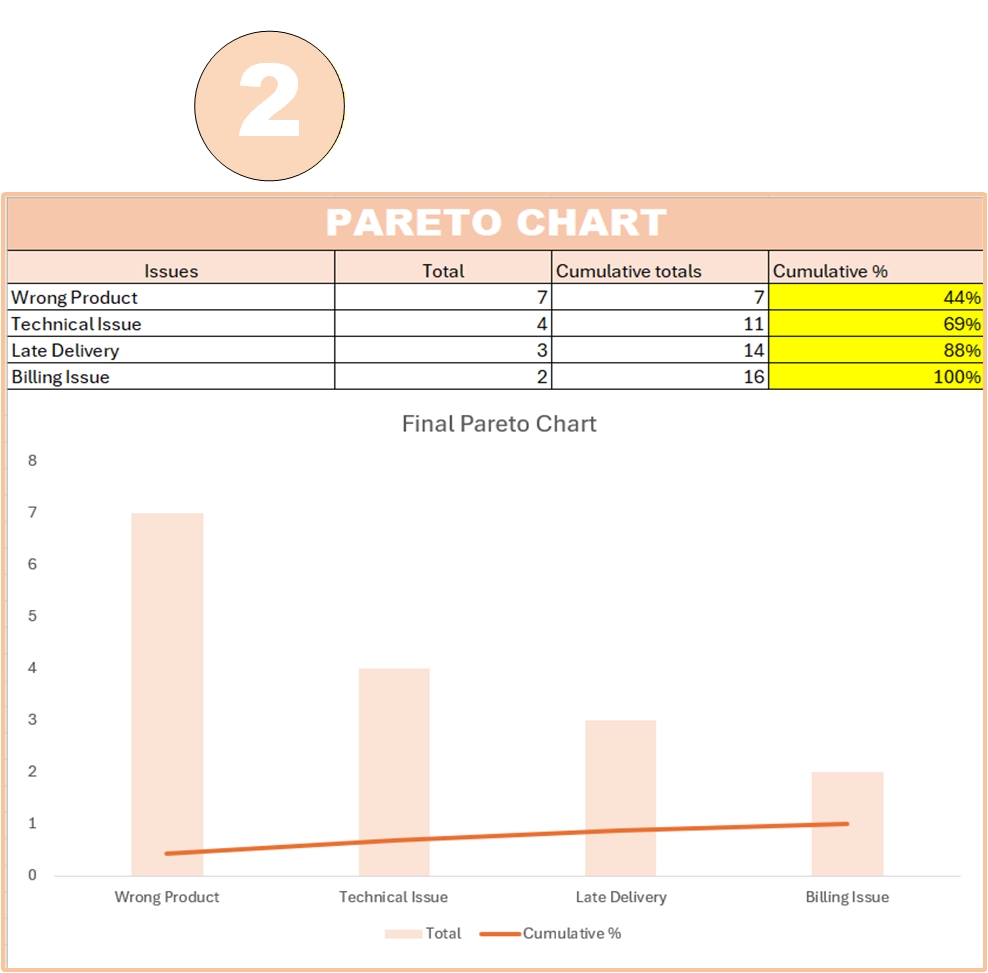
5. 📊 Pareto Chart (80/20 Defect Analysis)
Auto-sorted defect categories with cumulative percentage line — instantly shows the “vital few” causes responsible for 80% of problems.
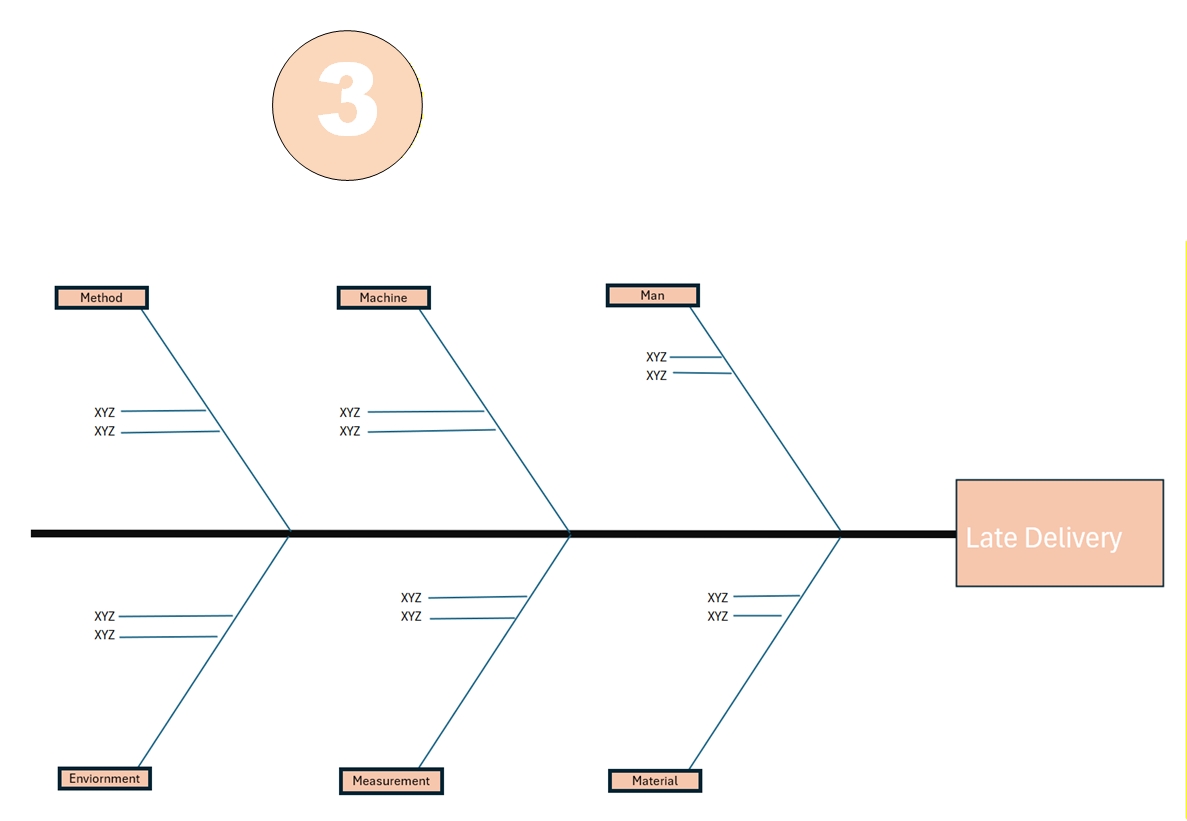
6. 🐟 Fishbone Diagram / Cause-and-Effect / Ishikawa
The Six Sigma classic — pre-built fishbone with the 6Ms (Man, Machine, Material, Method, Measurement, Mother Nature / Environment). Editable categories and branches.
7. ⚪ Scatter Plot (Correlation Analysis)
Auto-generated scatter diagram with trendline and correlation coefficient — for testing relationships between variables in root cause analysis.
Why this 7 QC Tools template beats the alternatives
vs free templates online
- All seven tools in one consistent dashboard, not seven random files from different sources
- Auto-calculated charts — no formulas to repair
- Professional formatting ready for executive presentations
- Beginner-friendly — designed for both students and practicing engineers
vs building from scratch
- Saves 4–6 hours per tool when you build them yourself in Excel
- Standard Six Sigma conventions used throughout (correct control chart formulas, correct Pareto sorting, correct fishbone structure)
- No statistical formula errors — every calculation has been verified
vs SPC software
- One-time payment, not a license fee
- Works offline, on any computer
- No IT approval, no install
- Editable to match your industry, your branding, your data
Who this 7 QC Tools template is for
- Lean Six Sigma Yellow, Green, and Black Belts running real projects
- Six Sigma students preparing for certification exams (the 7 QC Tools are heavily tested)
- Quality control engineers and managers building daily quality reports
- Production supervisors and operations teams running shop-floor quality reviews
- Manufacturing and industrial engineers doing root cause analysis
- Service industry quality teams (call centers, healthcare, banking — the tools work in any process)
- Continuous improvement and Kaizen leaders
- Engineering and MBA students taking quality management courses
- Lean Six Sigma trainers teaching the 7 tools (the template makes a great course companion)
Use cases — what people actually do with this template
🏭 Manufacturing example
A factory is seeing rising customer complaints. Quality engineer uses the Check Sheet to collect defect data for two weeks, the Pareto Chart to find that 73% of complaints come from three defect types, the Fishbone Diagram to brainstorm root causes for the top defect, the Scatter Plot to confirm correlation with a process variable, and the Control Chart to monitor whether the corrective action sticks.
☎️ Service example (call center)
A call center has rising “average handle time.” Manager uses the Flow Chart to map the call process, the Histogram to see the AHT distribution, and the Pareto Chart to identify the top 3 reasons calls run long. Within two weeks the team has a data-driven improvement plan.
🎓 Six Sigma certification example
A Green Belt candidate uses the template as the working file for their certification project. Every required quality tool is already in the workbook — they just plug in their project data, and their tollgate review presentation is 80% complete.
Frequently asked questions
Q: Does this template work in Excel for Mac? A: Yes. The 7 QC Tools template uses standard Excel formulas and charts that work in Excel for Windows, Mac, and Excel for Web. No macros required.
Q: Are there any macros or VBA? A: No. The template is 100% formula-driven — no macros, no VBA, no security warnings. It opens cleanly in any modern Excel version (Excel 2016 and above recommended).
Q: Will this template help me pass my Six Sigma Green Belt exam? A: The 7 QC Tools are heavily tested on Green Belt and Black Belt certification exams. The template gives you working examples of each tool with the correct formulas and structure — significantly better than memorizing diagrams from a textbook.
Q: What’s the difference between this and the 7 tools inside the DMAIC Toolkit? A: The DMAIC Toolkit includes basic versions of these tools alongside 25+ other Lean Six Sigma templates. This standalone 7 QC Tools template is more in-depth — auto-generated charts, full Pareto with cumulative line, full X-bar/R control chart, and a fishbone with built-in 6M categories. Get this if you specifically need the 7 QC Tools done well; get the DMAIC Toolkit if you need the full Lean Six Sigma project toolkit.
Q: Are these the original Ishikawa “Seven Basic Tools of Quality”? A: Yes — these are the seven tools defined by Kaoru Ishikawa as the foundation of statistical quality control. The template uses the standard Six Sigma versions of each tool taught in ASQ, IASSC, and Lean Six Sigma certification programs.
Q: Can I use this for a service industry, not just manufacturing? A: Absolutely. The 7 QC Tools are process-agnostic. Common service-sector uses include call centers, healthcare (patient flow, medication errors), banking (transaction errors), insurance (claims processing), software (defect tracking), and education.
Q: Will the charts update automatically when I enter new data? A: Yes. The Histogram, Pareto Chart, Control Chart, and Scatter Plot all auto-update when you enter or change data. The Flow Chart and Fishbone Diagram are editable visual templates — you adjust them manually for your specific process.
Q: How do I receive the file after purchase? A: Instant download link by email immediately after checkout. The file is also available in your account area.
Q: Refund policy? A: 7-day money-back guarantee — if it’s not the right fit, contact us for a full refund.
Related Lean Six Sigma tools
The 7 QC Tools template is commonly used alongside:
- DMAIC Toolkit — the full Lean Six Sigma project toolkit (30+ templates including these 7 tools)
- A3 Problem Solving Template — to document findings from your QC tools analysis
- Value Stream Mapping Excel Template — for the process visualization step
- OEE Excel Dashboard with Sigma Level — for tracking quality KPIs over time
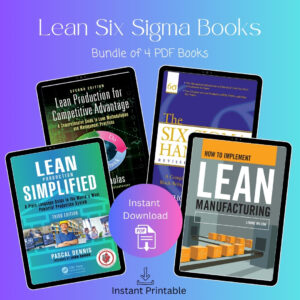
- Lean Six Sigma Books Bundle — companion reading for Six Sigma certification
- Value Stream Mapping Course — full VSM training course
Click “Add to cart” above to download the complete 7 QC Tools Excel Template — instant access.
Reviews
There are no reviews yet.